returns = _utils.download_returns('SPY', '5y')
benchmark = _utils.download_returns('QQQ', '5y')
plot_returns_bars(returns, benchmark, returns_label="SPY", benchmark_label="QQQ")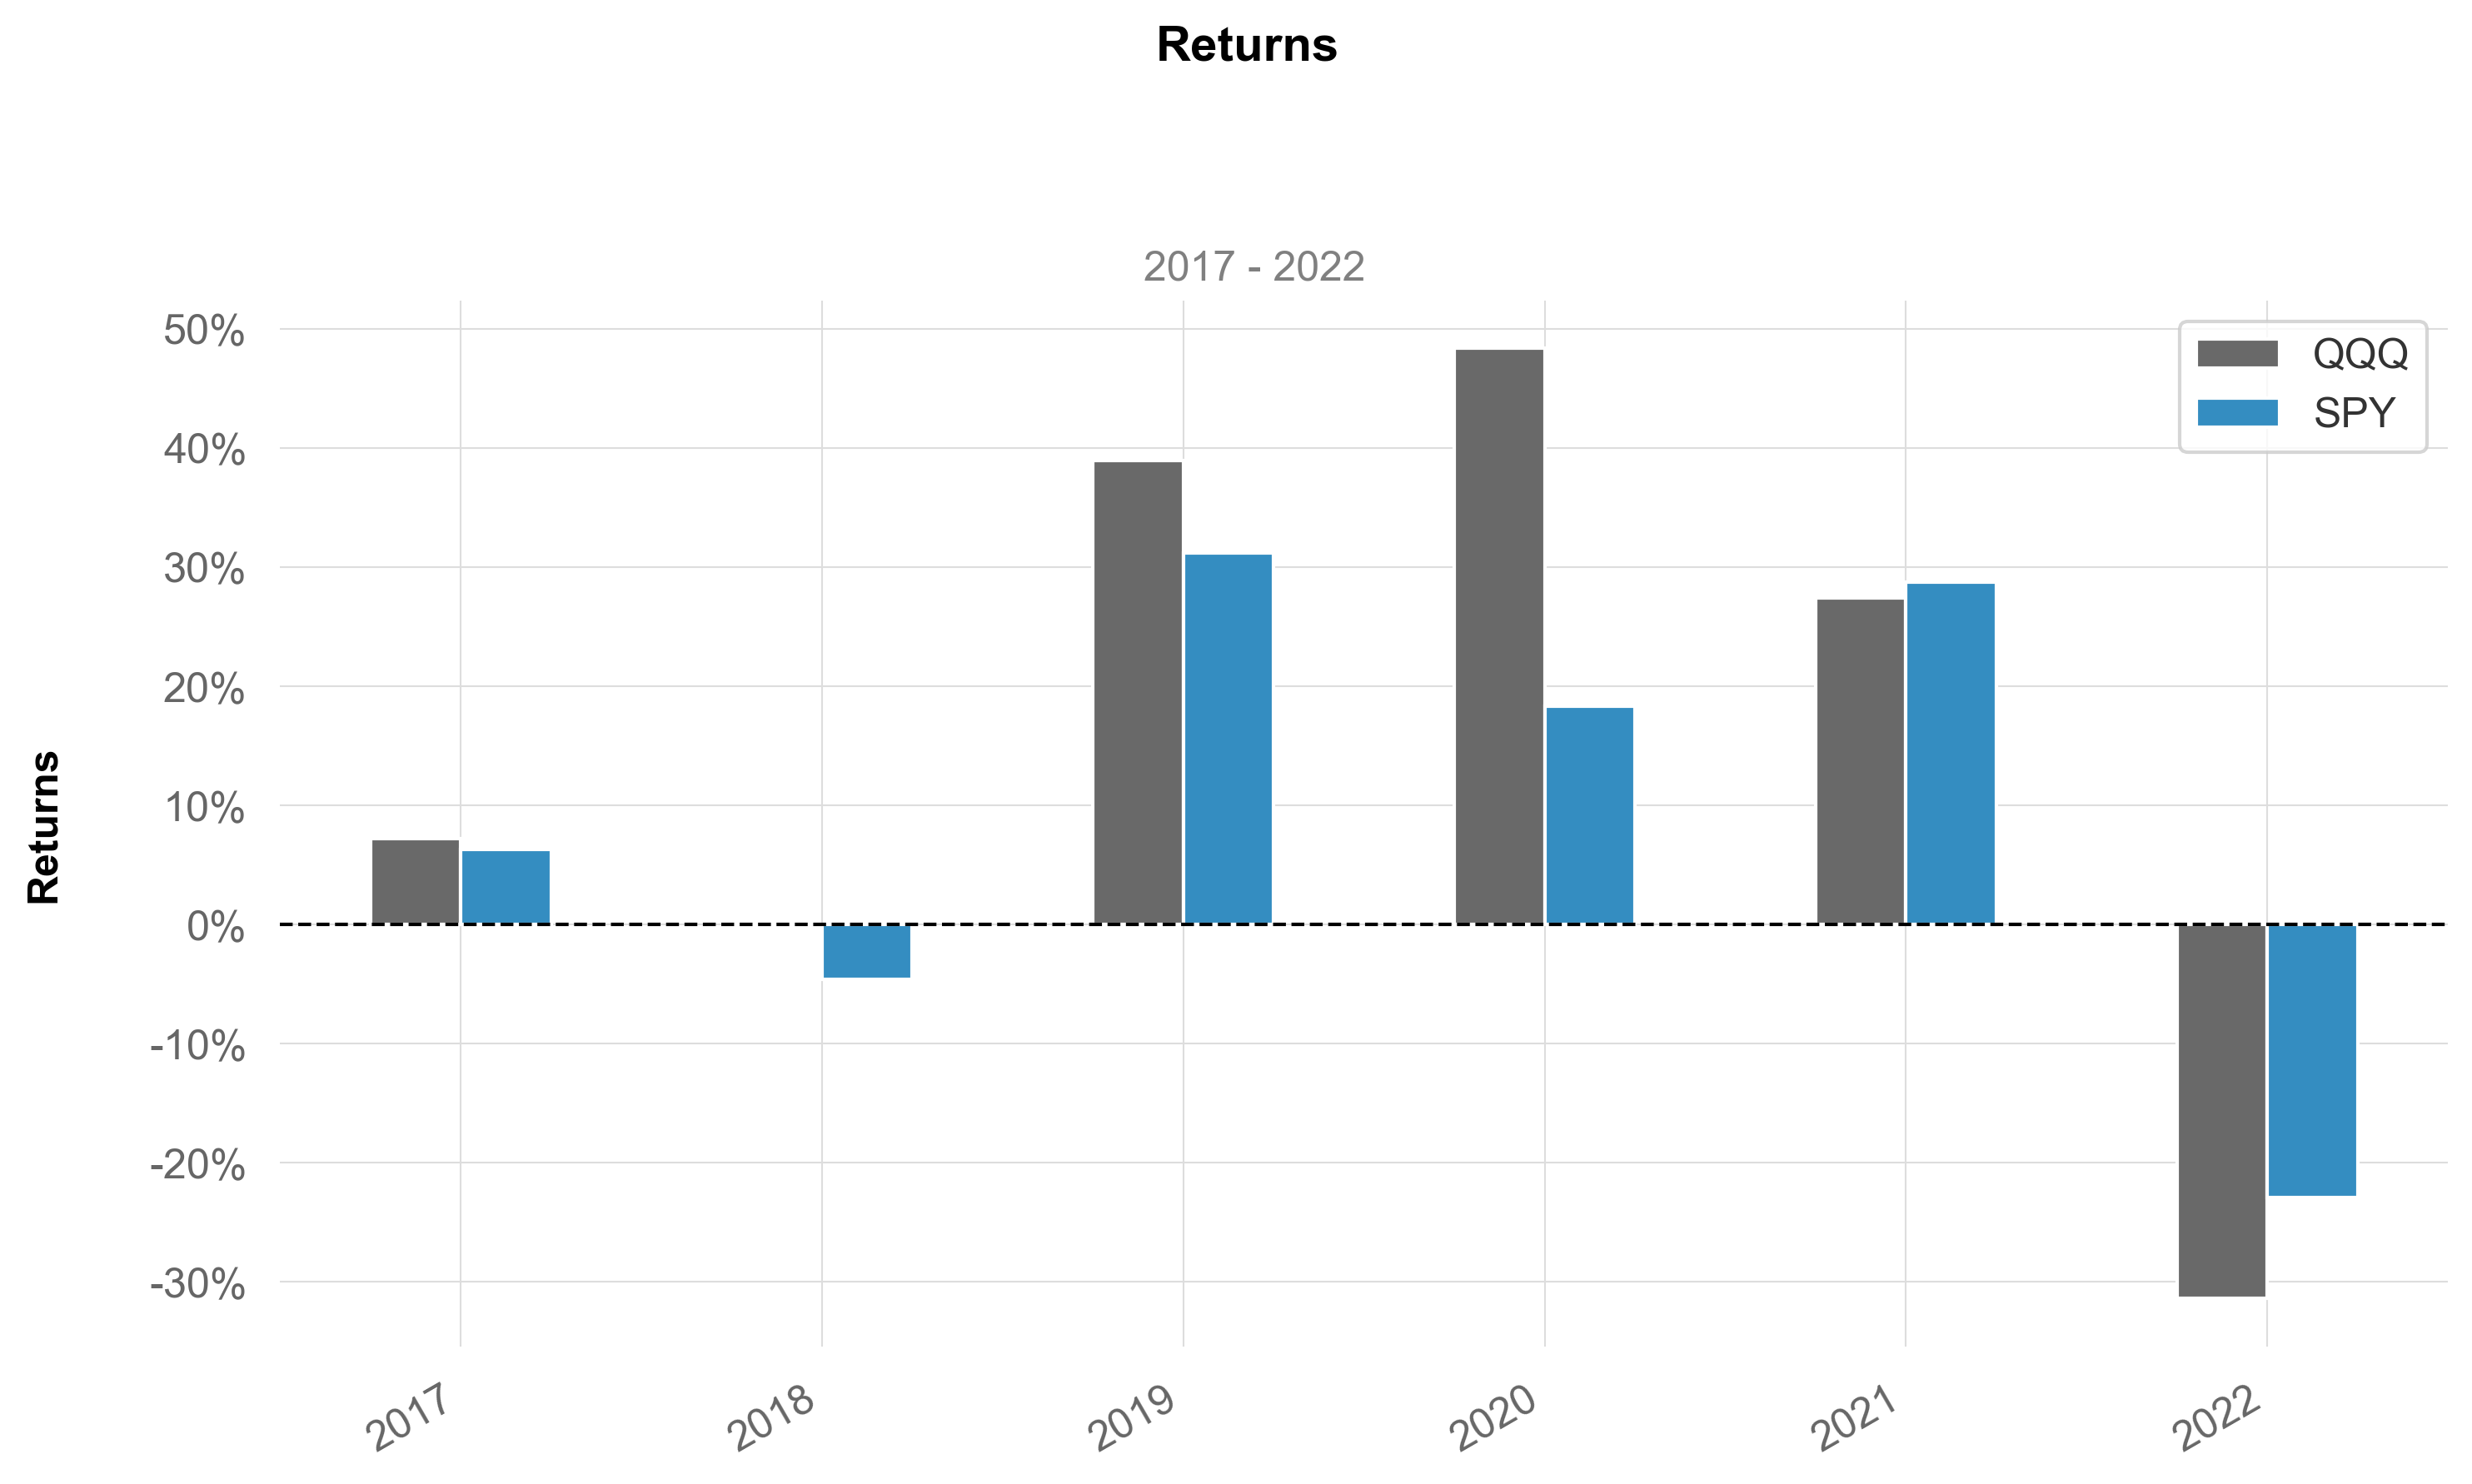
format_pct_axis (x, _)
format_cur_axis (x, _)
 plot_returns_bars (returns, benchmark=None, returns_label='Strategy',
                    benchmark_label='Benchmark', hline=None, hlw=None,
                    hlcolor='red', hllabel='', resample='A',
                    title='Returns', match_volatility=False,
                    log_scale=False, figsize=(10, 6), grayscale=False,
                    fontname='Arial', ylabel=True, subtitle=True,
                    savefig=None, show=True)
returns = _utils.download_returns('SPY', '5y')
benchmark = _utils.download_returns('QQQ', '5y')
plot_returns_bars(returns, benchmark, returns_label="SPY", benchmark_label="QQQ")
 plot_timeseries (returns, benchmark=None, title='Returns',
                  compound=False, cumulative=True, fill=False,
                  returns_label='Strategy', benchmark_label='Benchmark',
                  hline=None, hlw=None, hlcolor='red', hllabel='',
                  percent=True, match_volatility=False, log_scale=False,
                  resample=None, lw=1.5, figsize=(10, 6), ylabel='',
                  grayscale=False, fontname='Arial', subtitle=True,
                  savefig=None, show=True)
returns = _utils.download_returns('SPY', '5y')
benchmark = _utils.download_returns('QQQ', '5y')
plot_timeseries(returns, benchmark, compound = True, returns_label="SPY", benchmark_label="QQQ")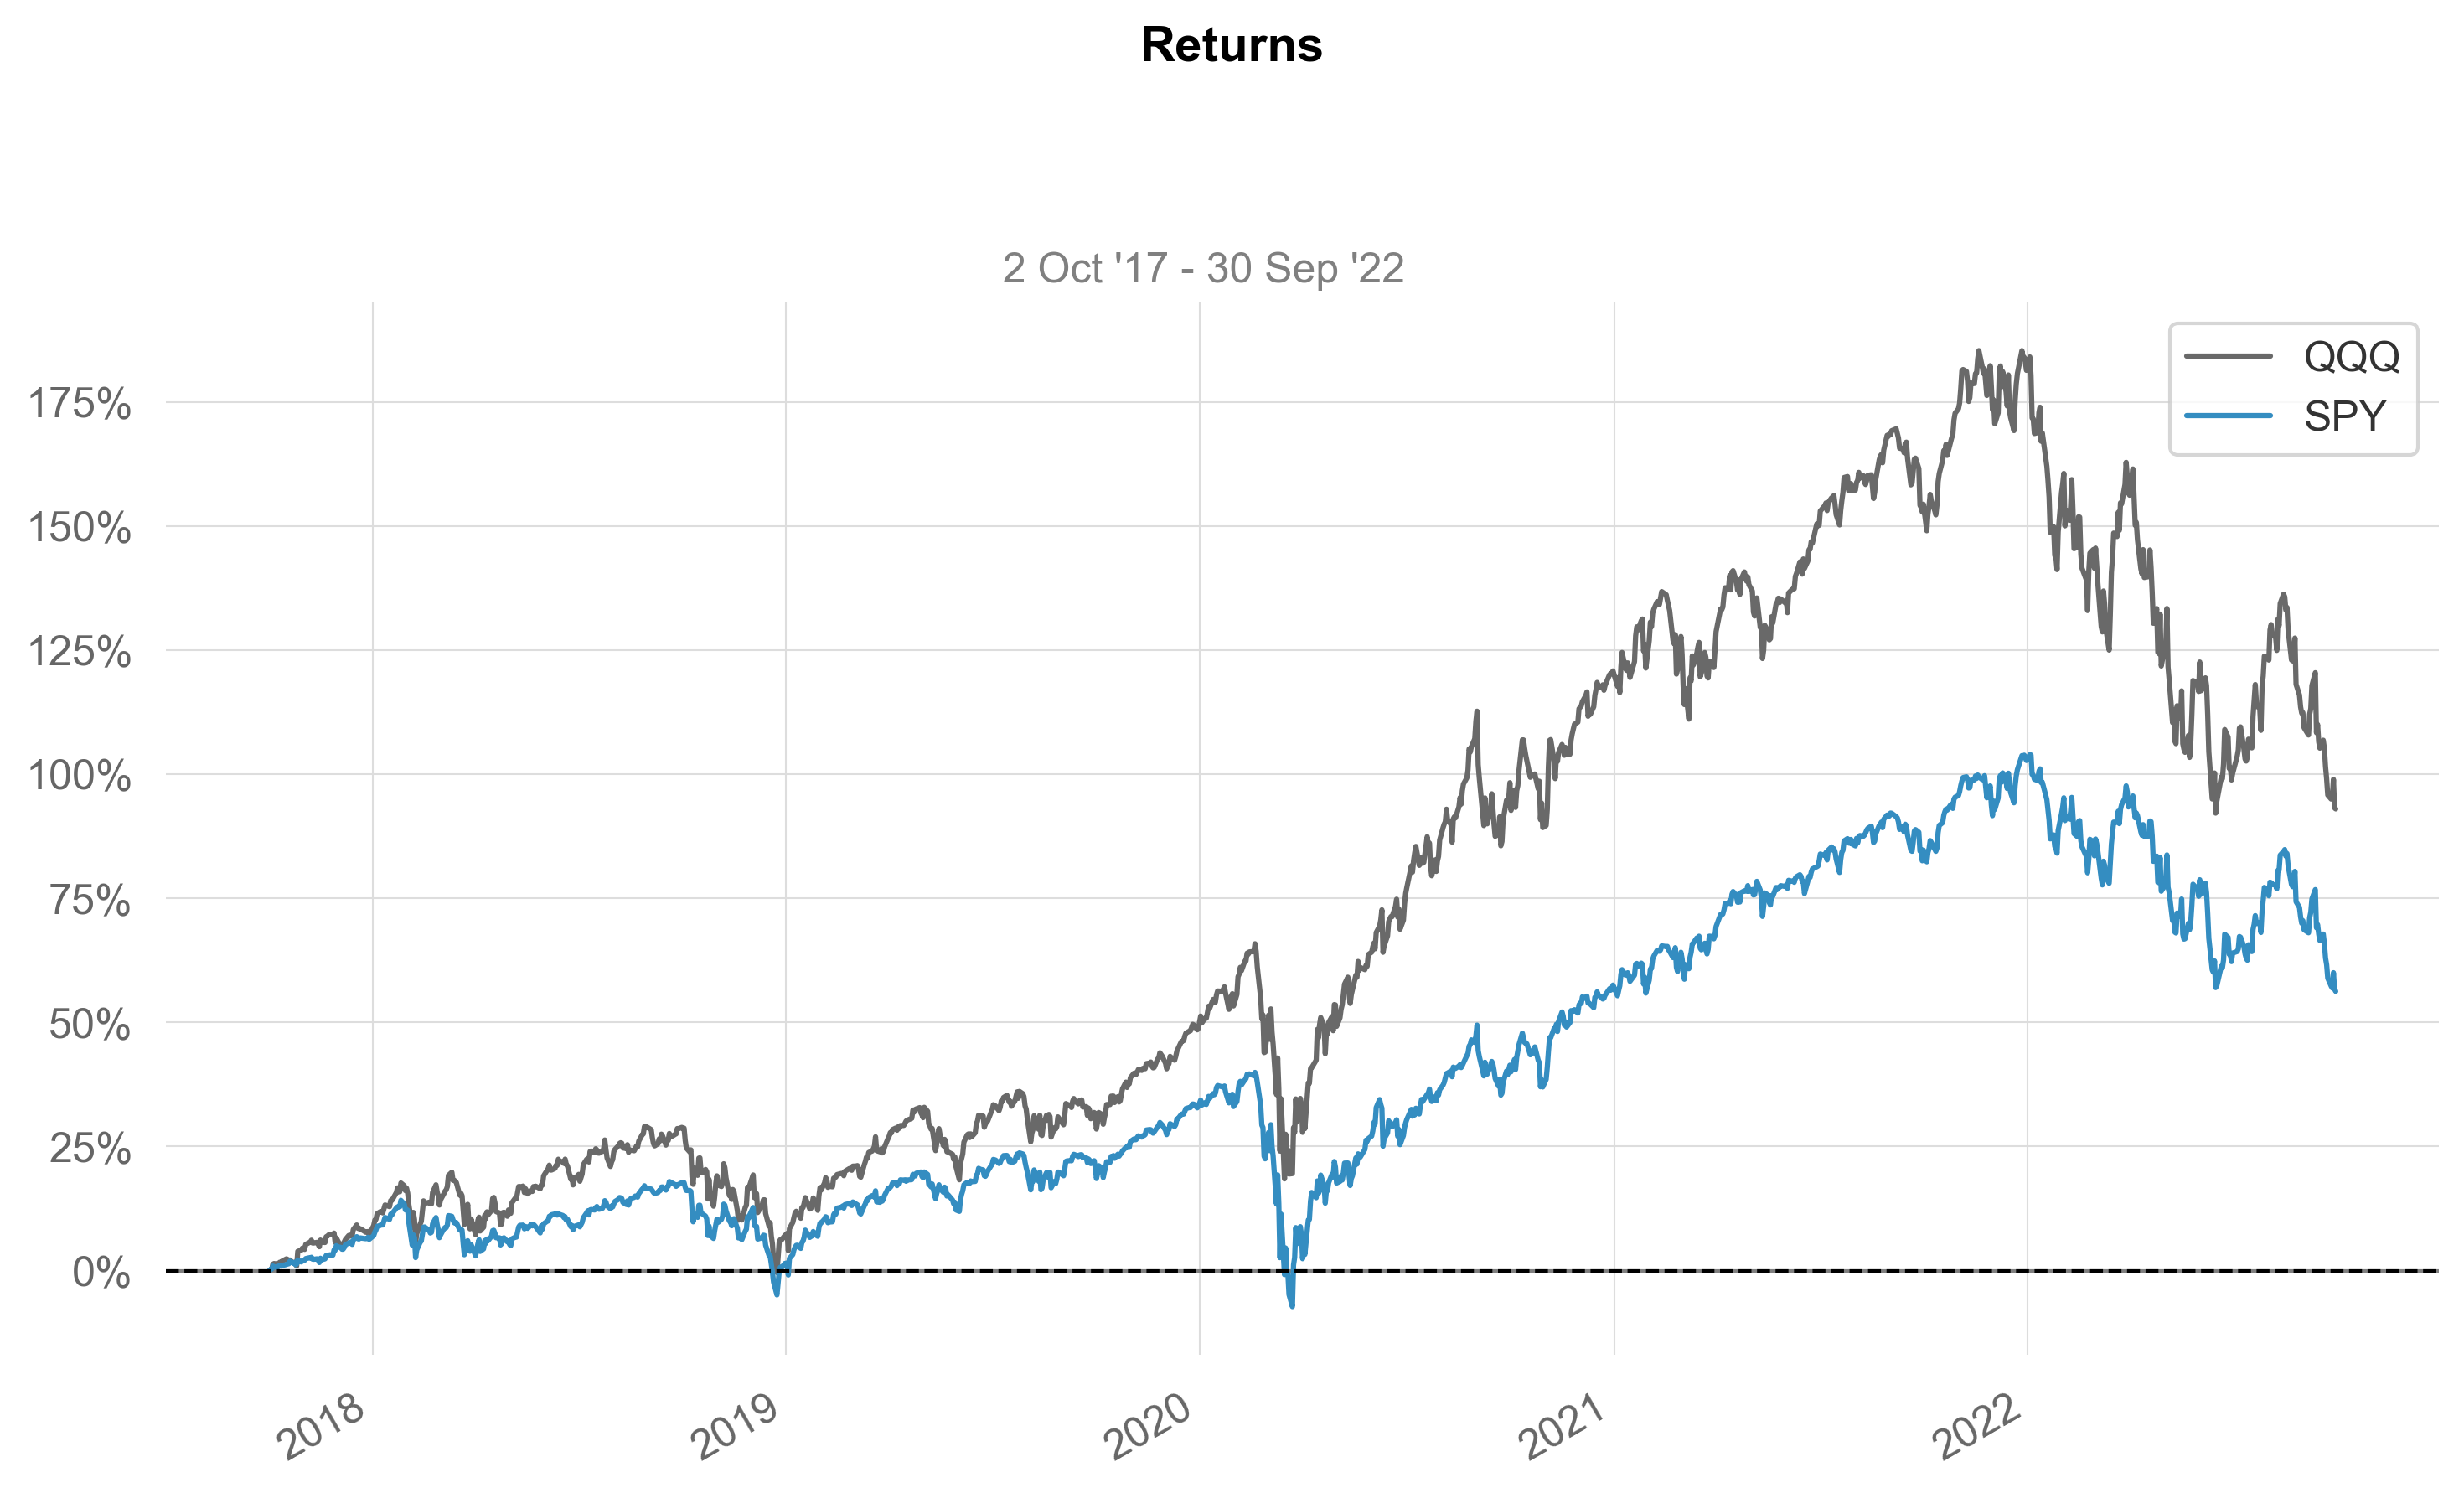
 plot_histogram (returns, resample='M', bins=20, fontname='Arial',
                 grayscale=False, title='Returns', kde=True, figsize=(10,
                 6), ylabel=True, subtitle=True, compounded=True,
                 savefig=None, show=True)
returns = _utils.download_returns('SPY', '5y')
plot_histogram(returns)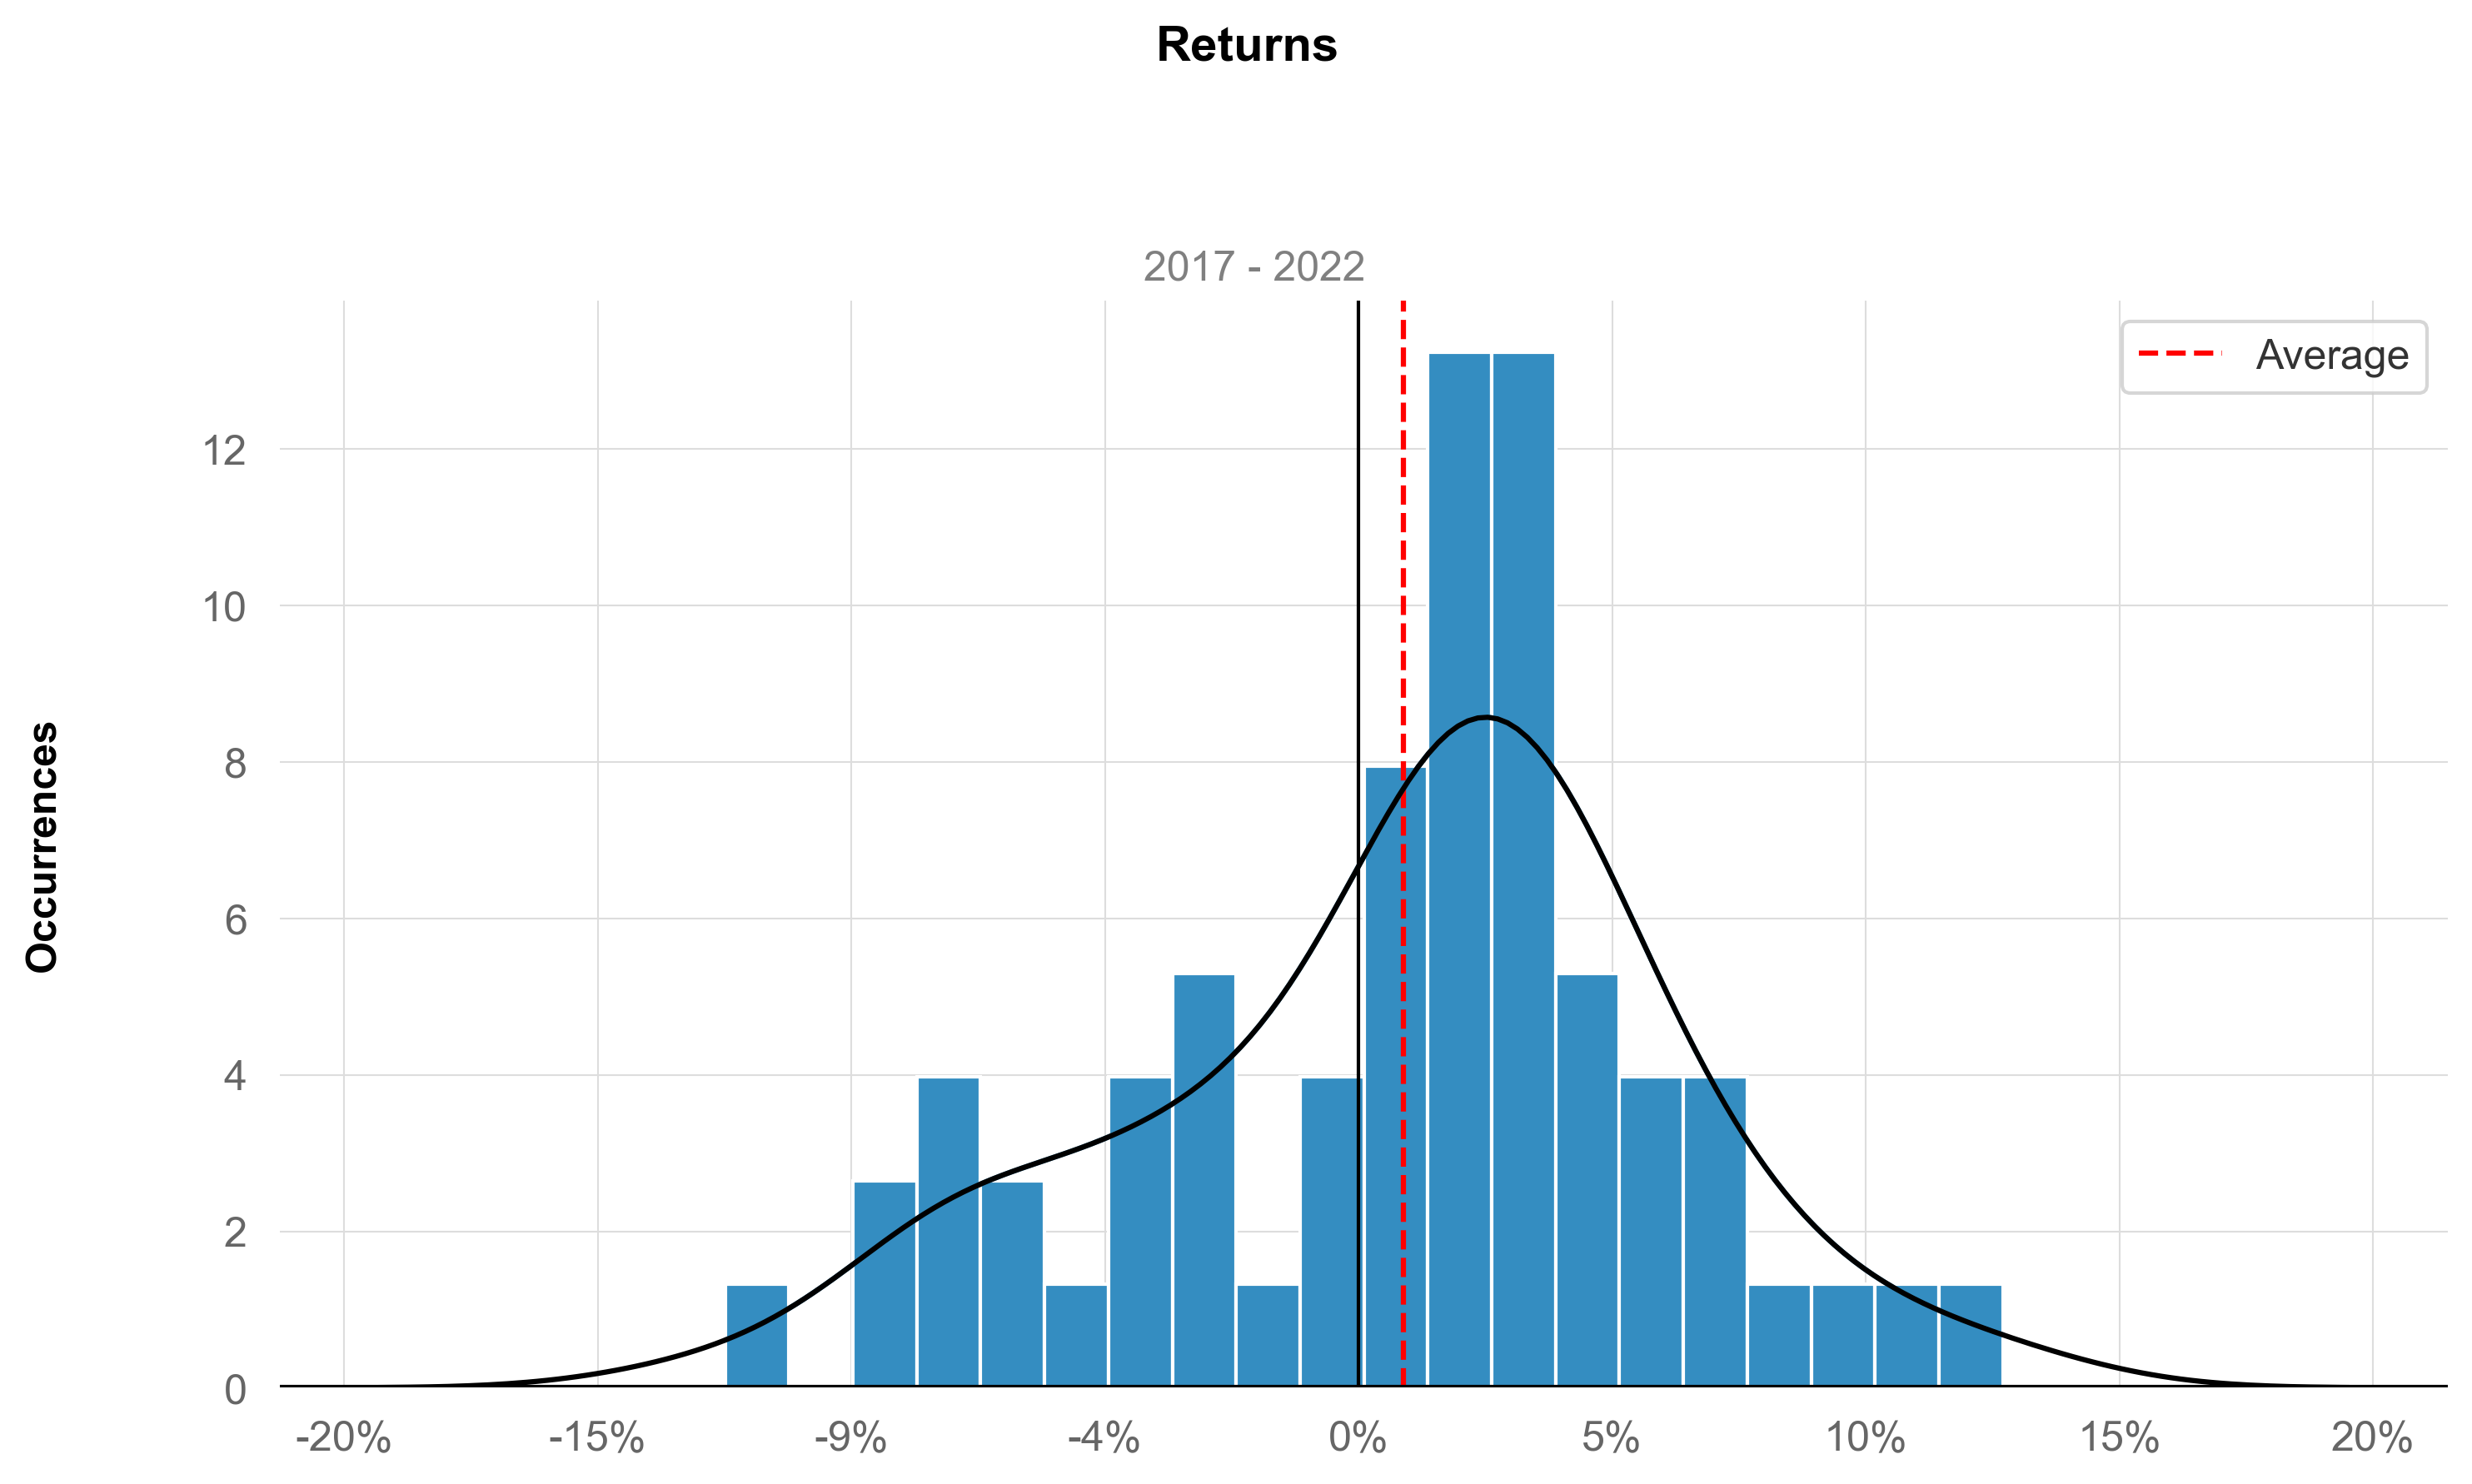
 plot_rolling_stats (returns, benchmark=None, title='',
                     returns_label='Strategy',
                     benchmark_label='Benchmark', hline=None, hlw=None,
                     hlcolor='red', hllabel='', lw=1.5, figsize=(10, 6),
                     ylabel='', grayscale=False, fontname='Arial',
                     subtitle=True, savefig=None, show=True)
returns = _stats.rolling_volatility(_utils.download_returns('SPY', '5y'))
plot_rolling_stats(returns, title = 'Rolling Volatility', hline=returns.mean(), hlw=1.5)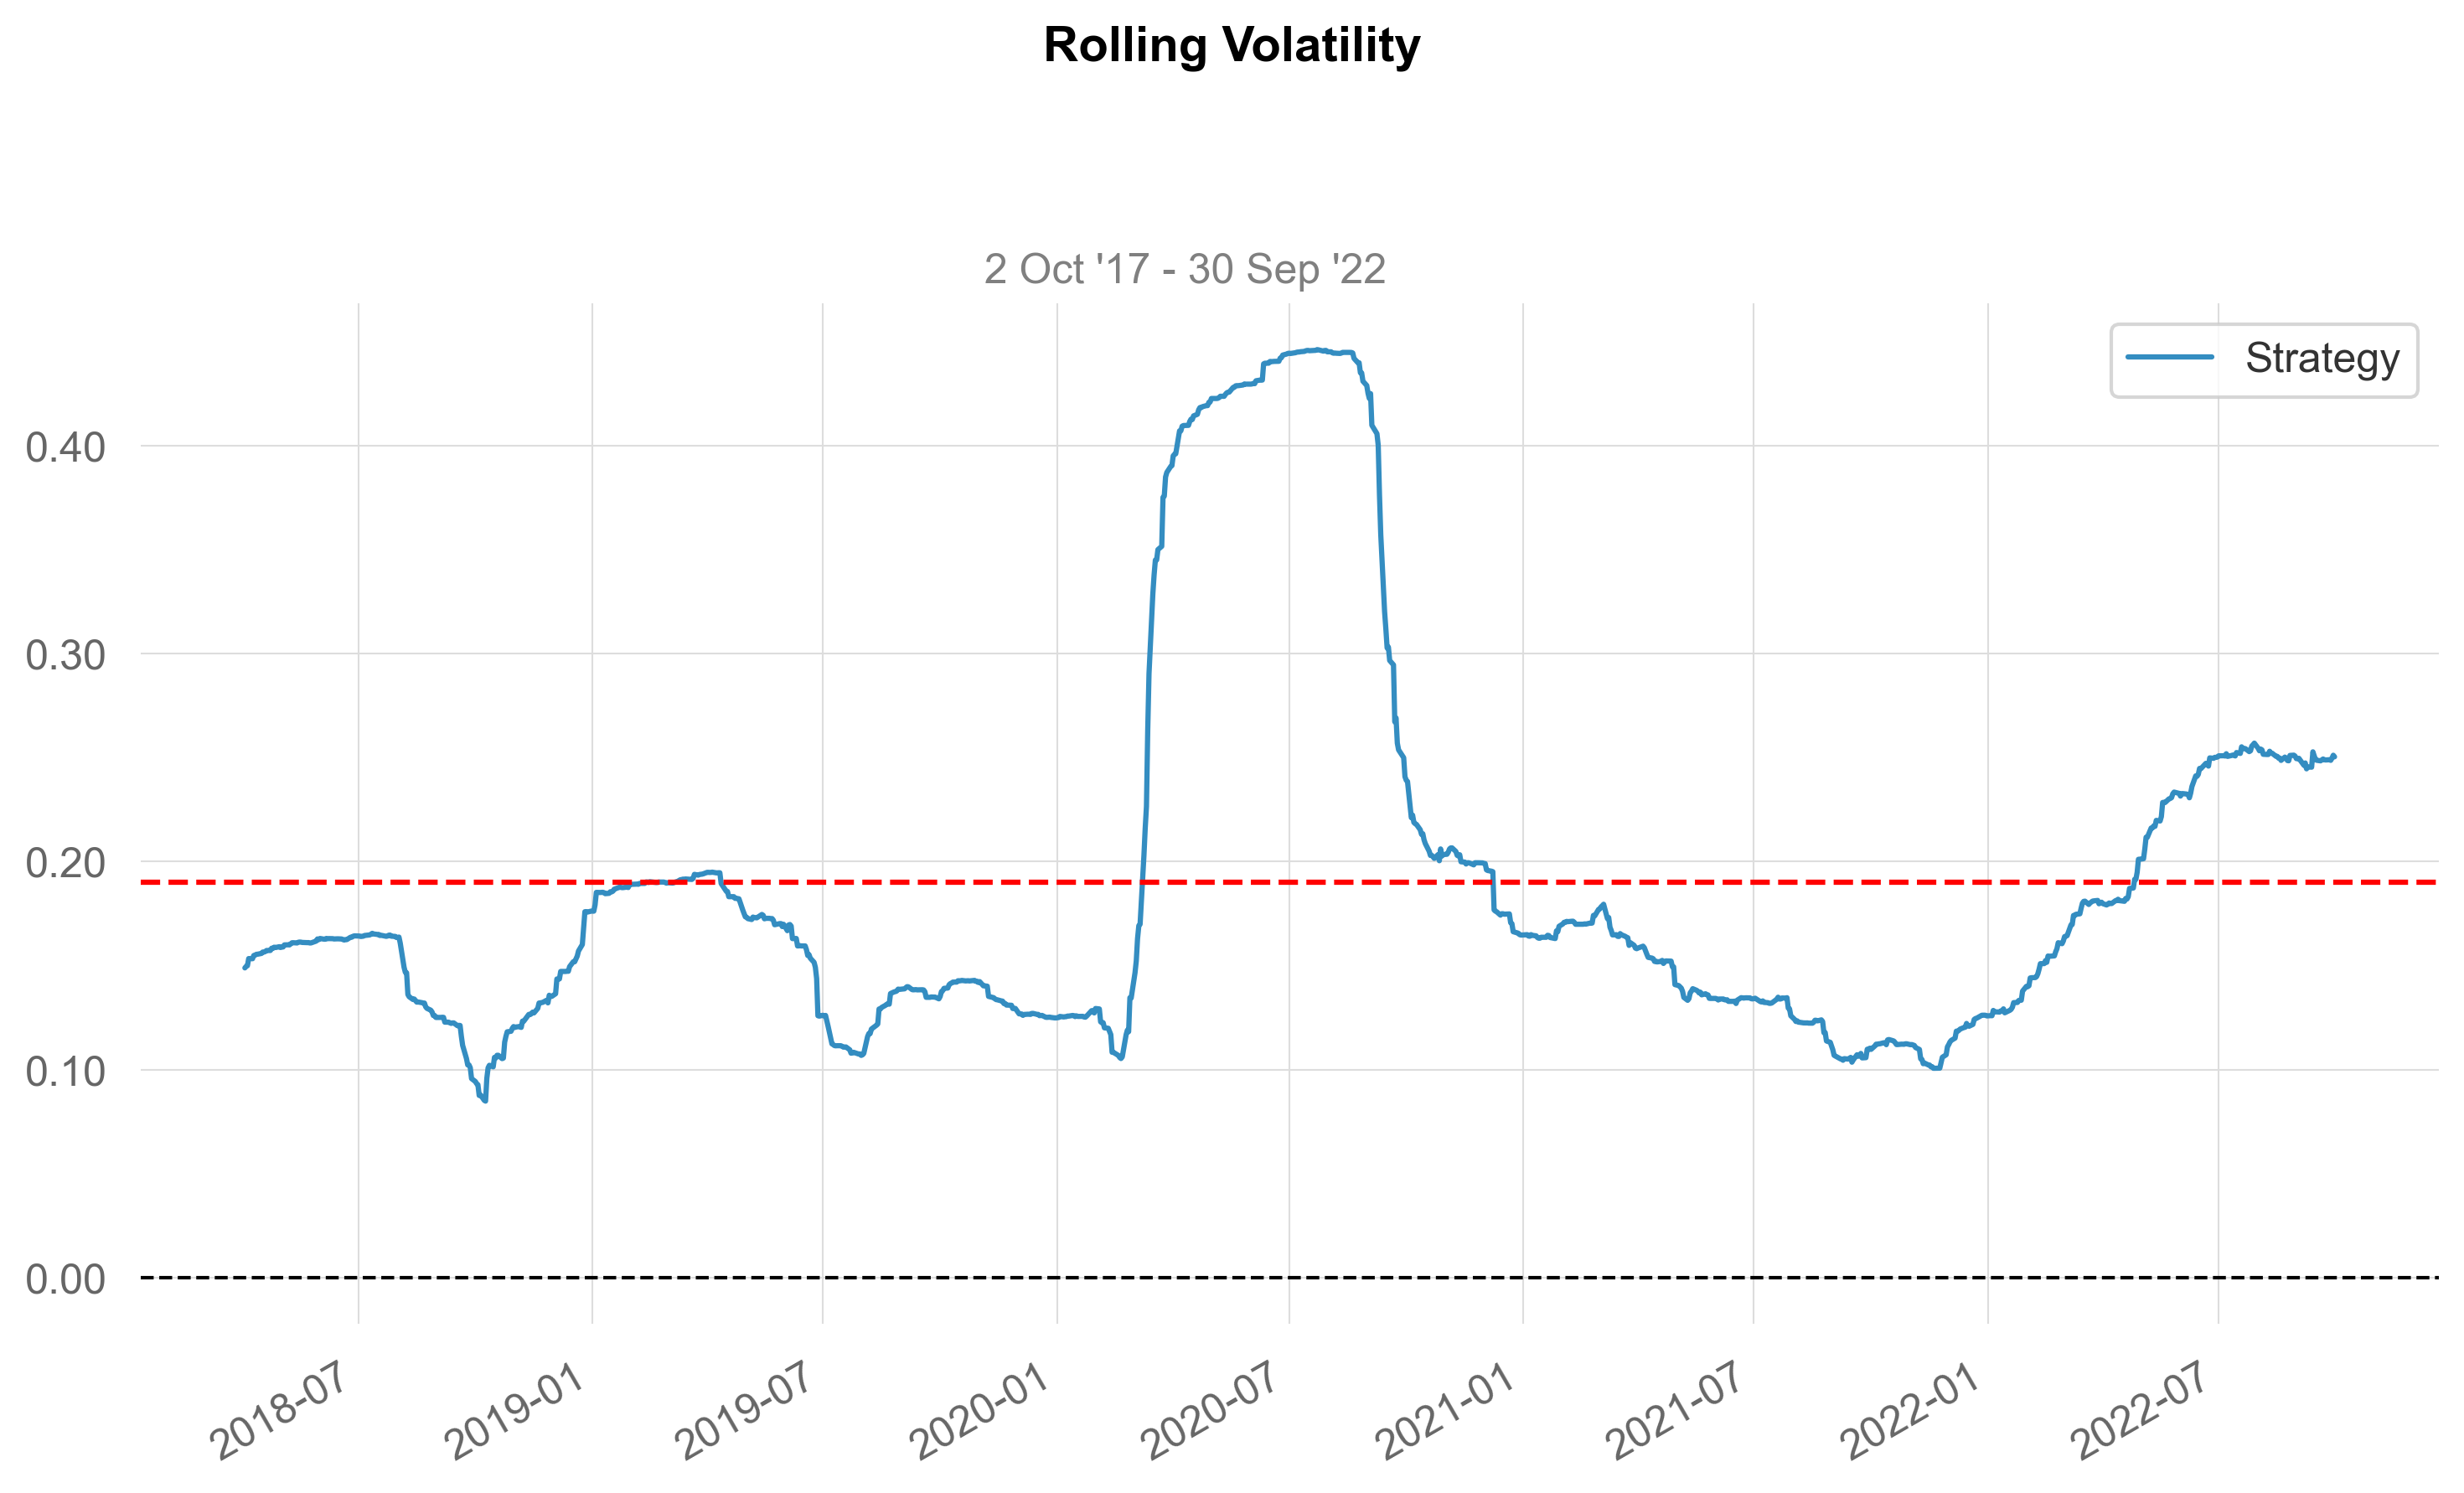
 plot_rolling_beta (returns, benchmark, window1=126, window1_label='',
                    window2=None, window2_label='', title='',
                    hlcolor='red', figsize=(10, 6), grayscale=False,
                    fontname='Arial', lw=1.5, ylabel=True, subtitle=True,
                    savefig=None, show=True)
returns = _utils.download_returns('SPY', '5y')
benchmark = _utils.download_returns('QQQ', '5y')
plot_rolling_beta(returns, benchmark, title="Rolling Beta", window1_label='126 days', window2=252, window2_label='252 days')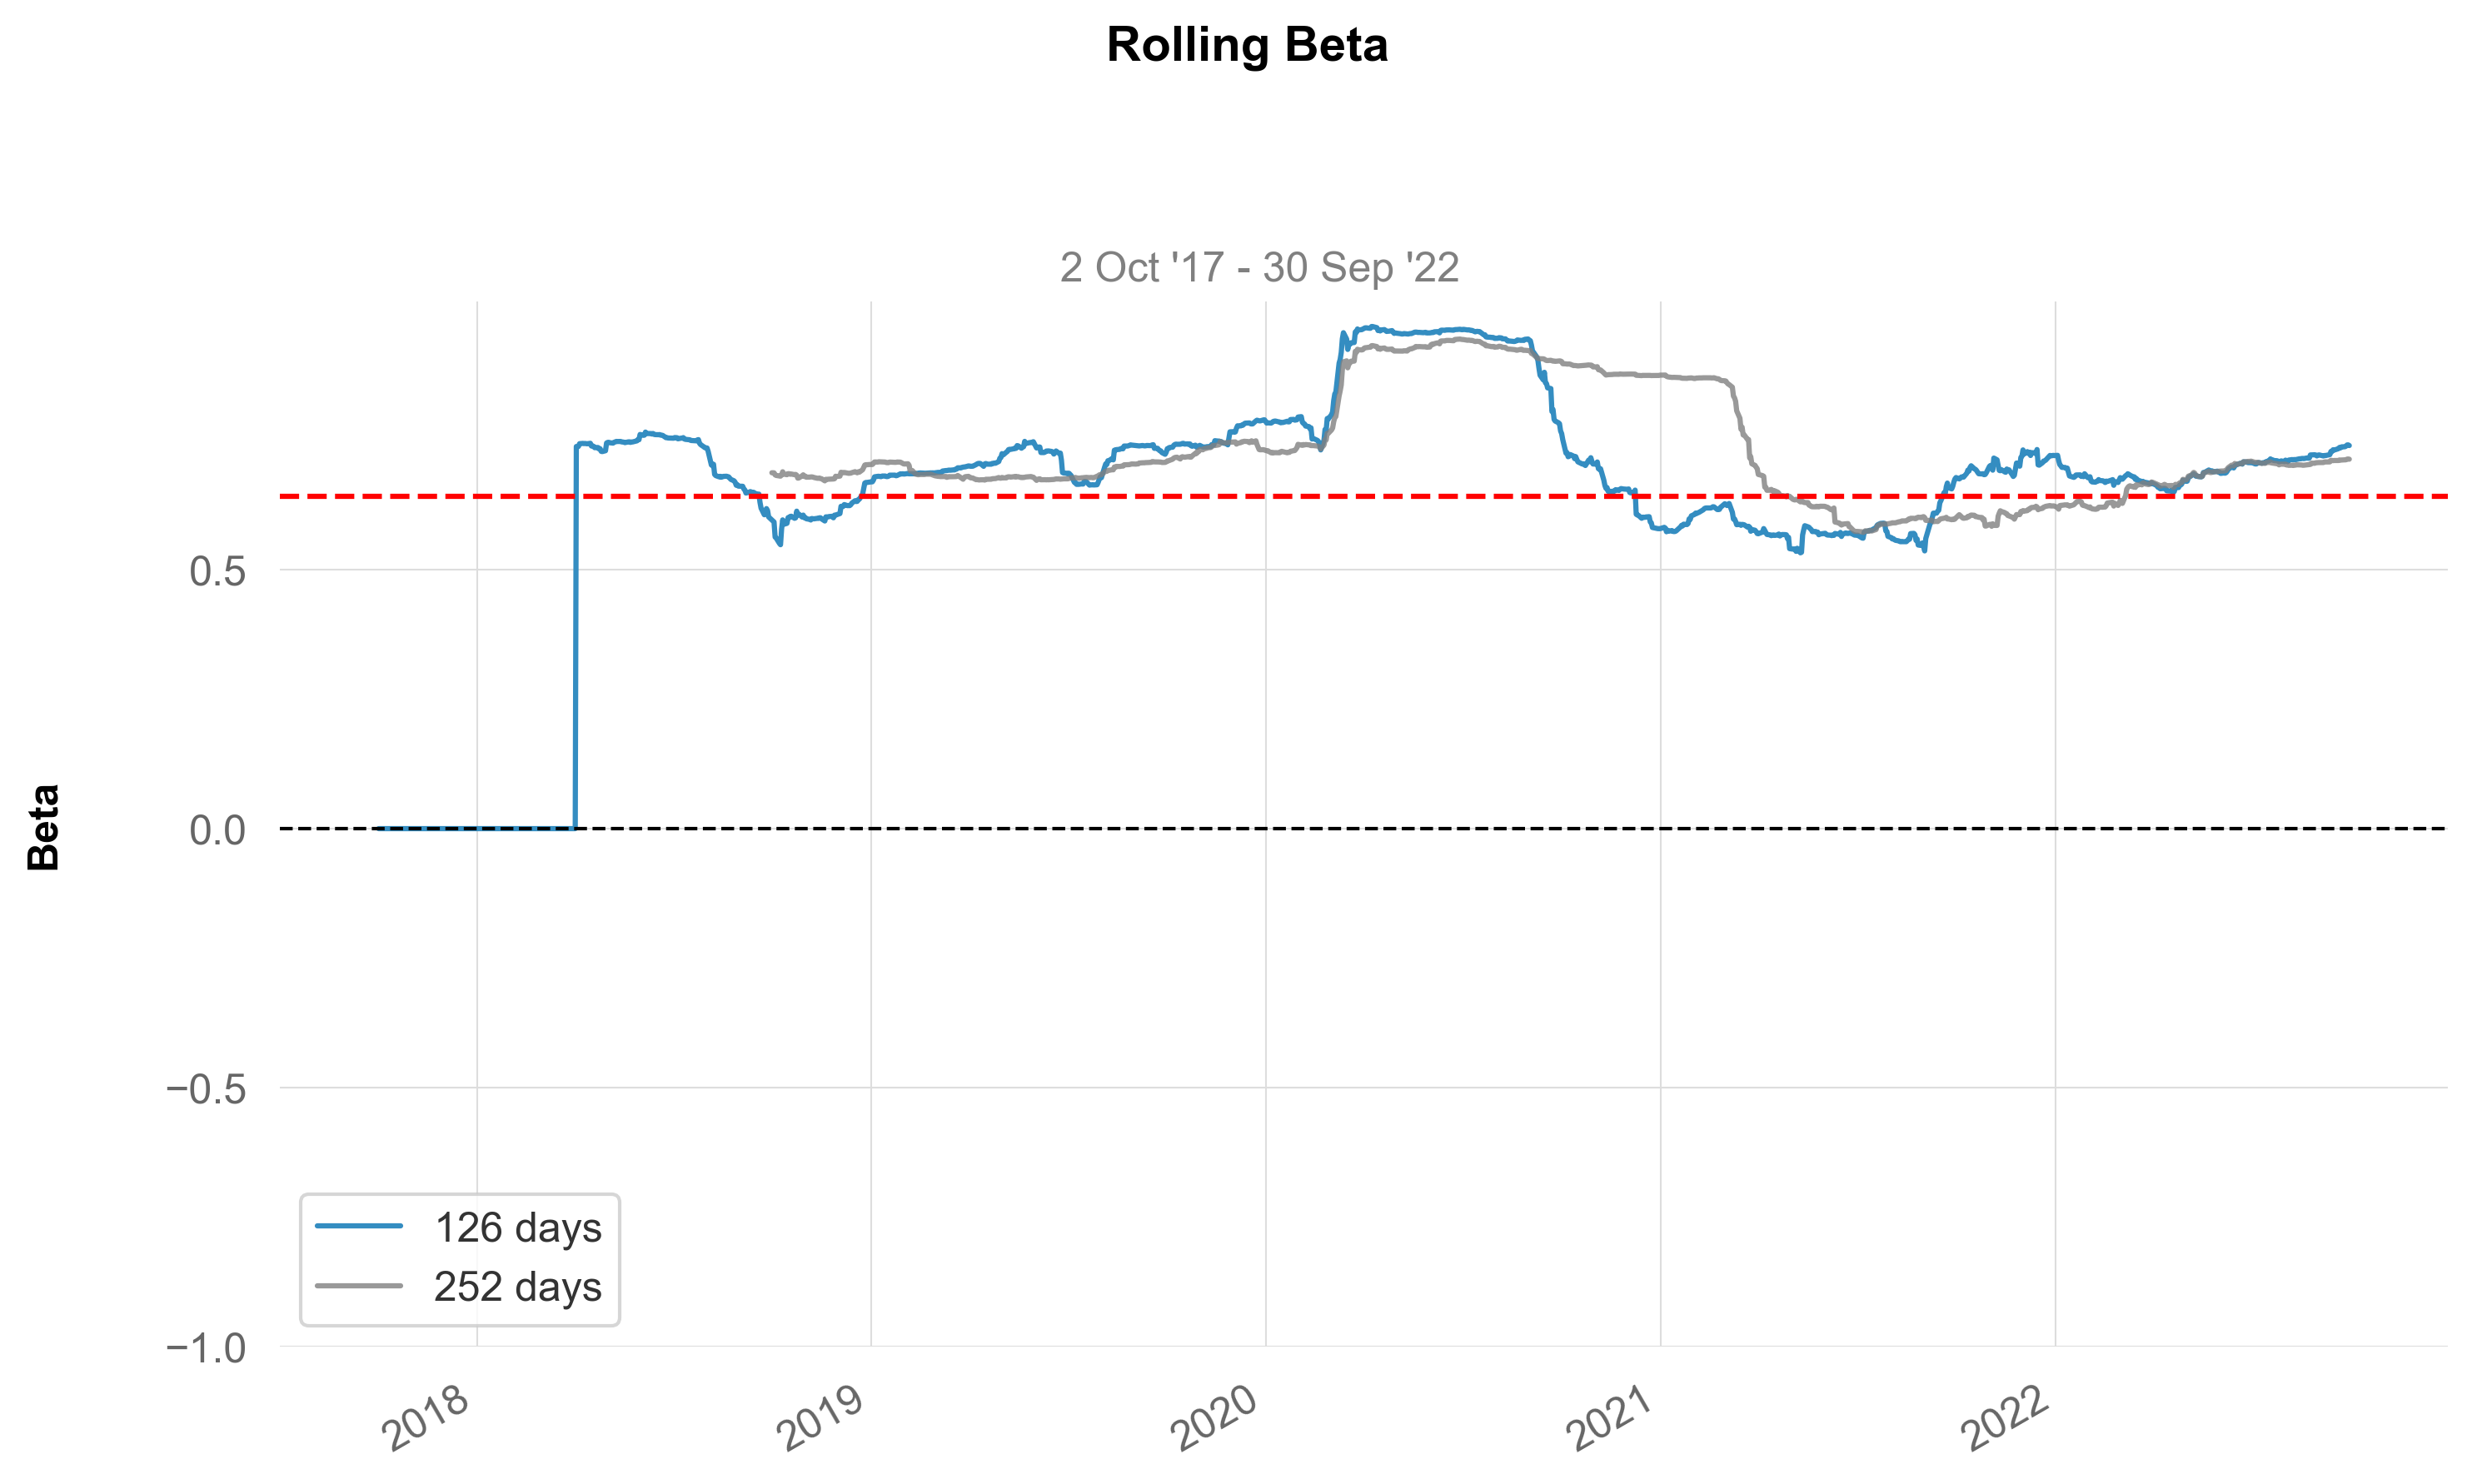
 plot_longest_drawdowns (returns, periods=5, lw=1.5, fontname='Arial',
                         grayscale=False, log_scale=False, figsize=(10,
                         6), ylabel=True, subtitle=True, compounded=True,
                         savefig=None, show=True)
returns = _utils.download_returns('SPY', '5y')
plot_longest_drawdowns(returns)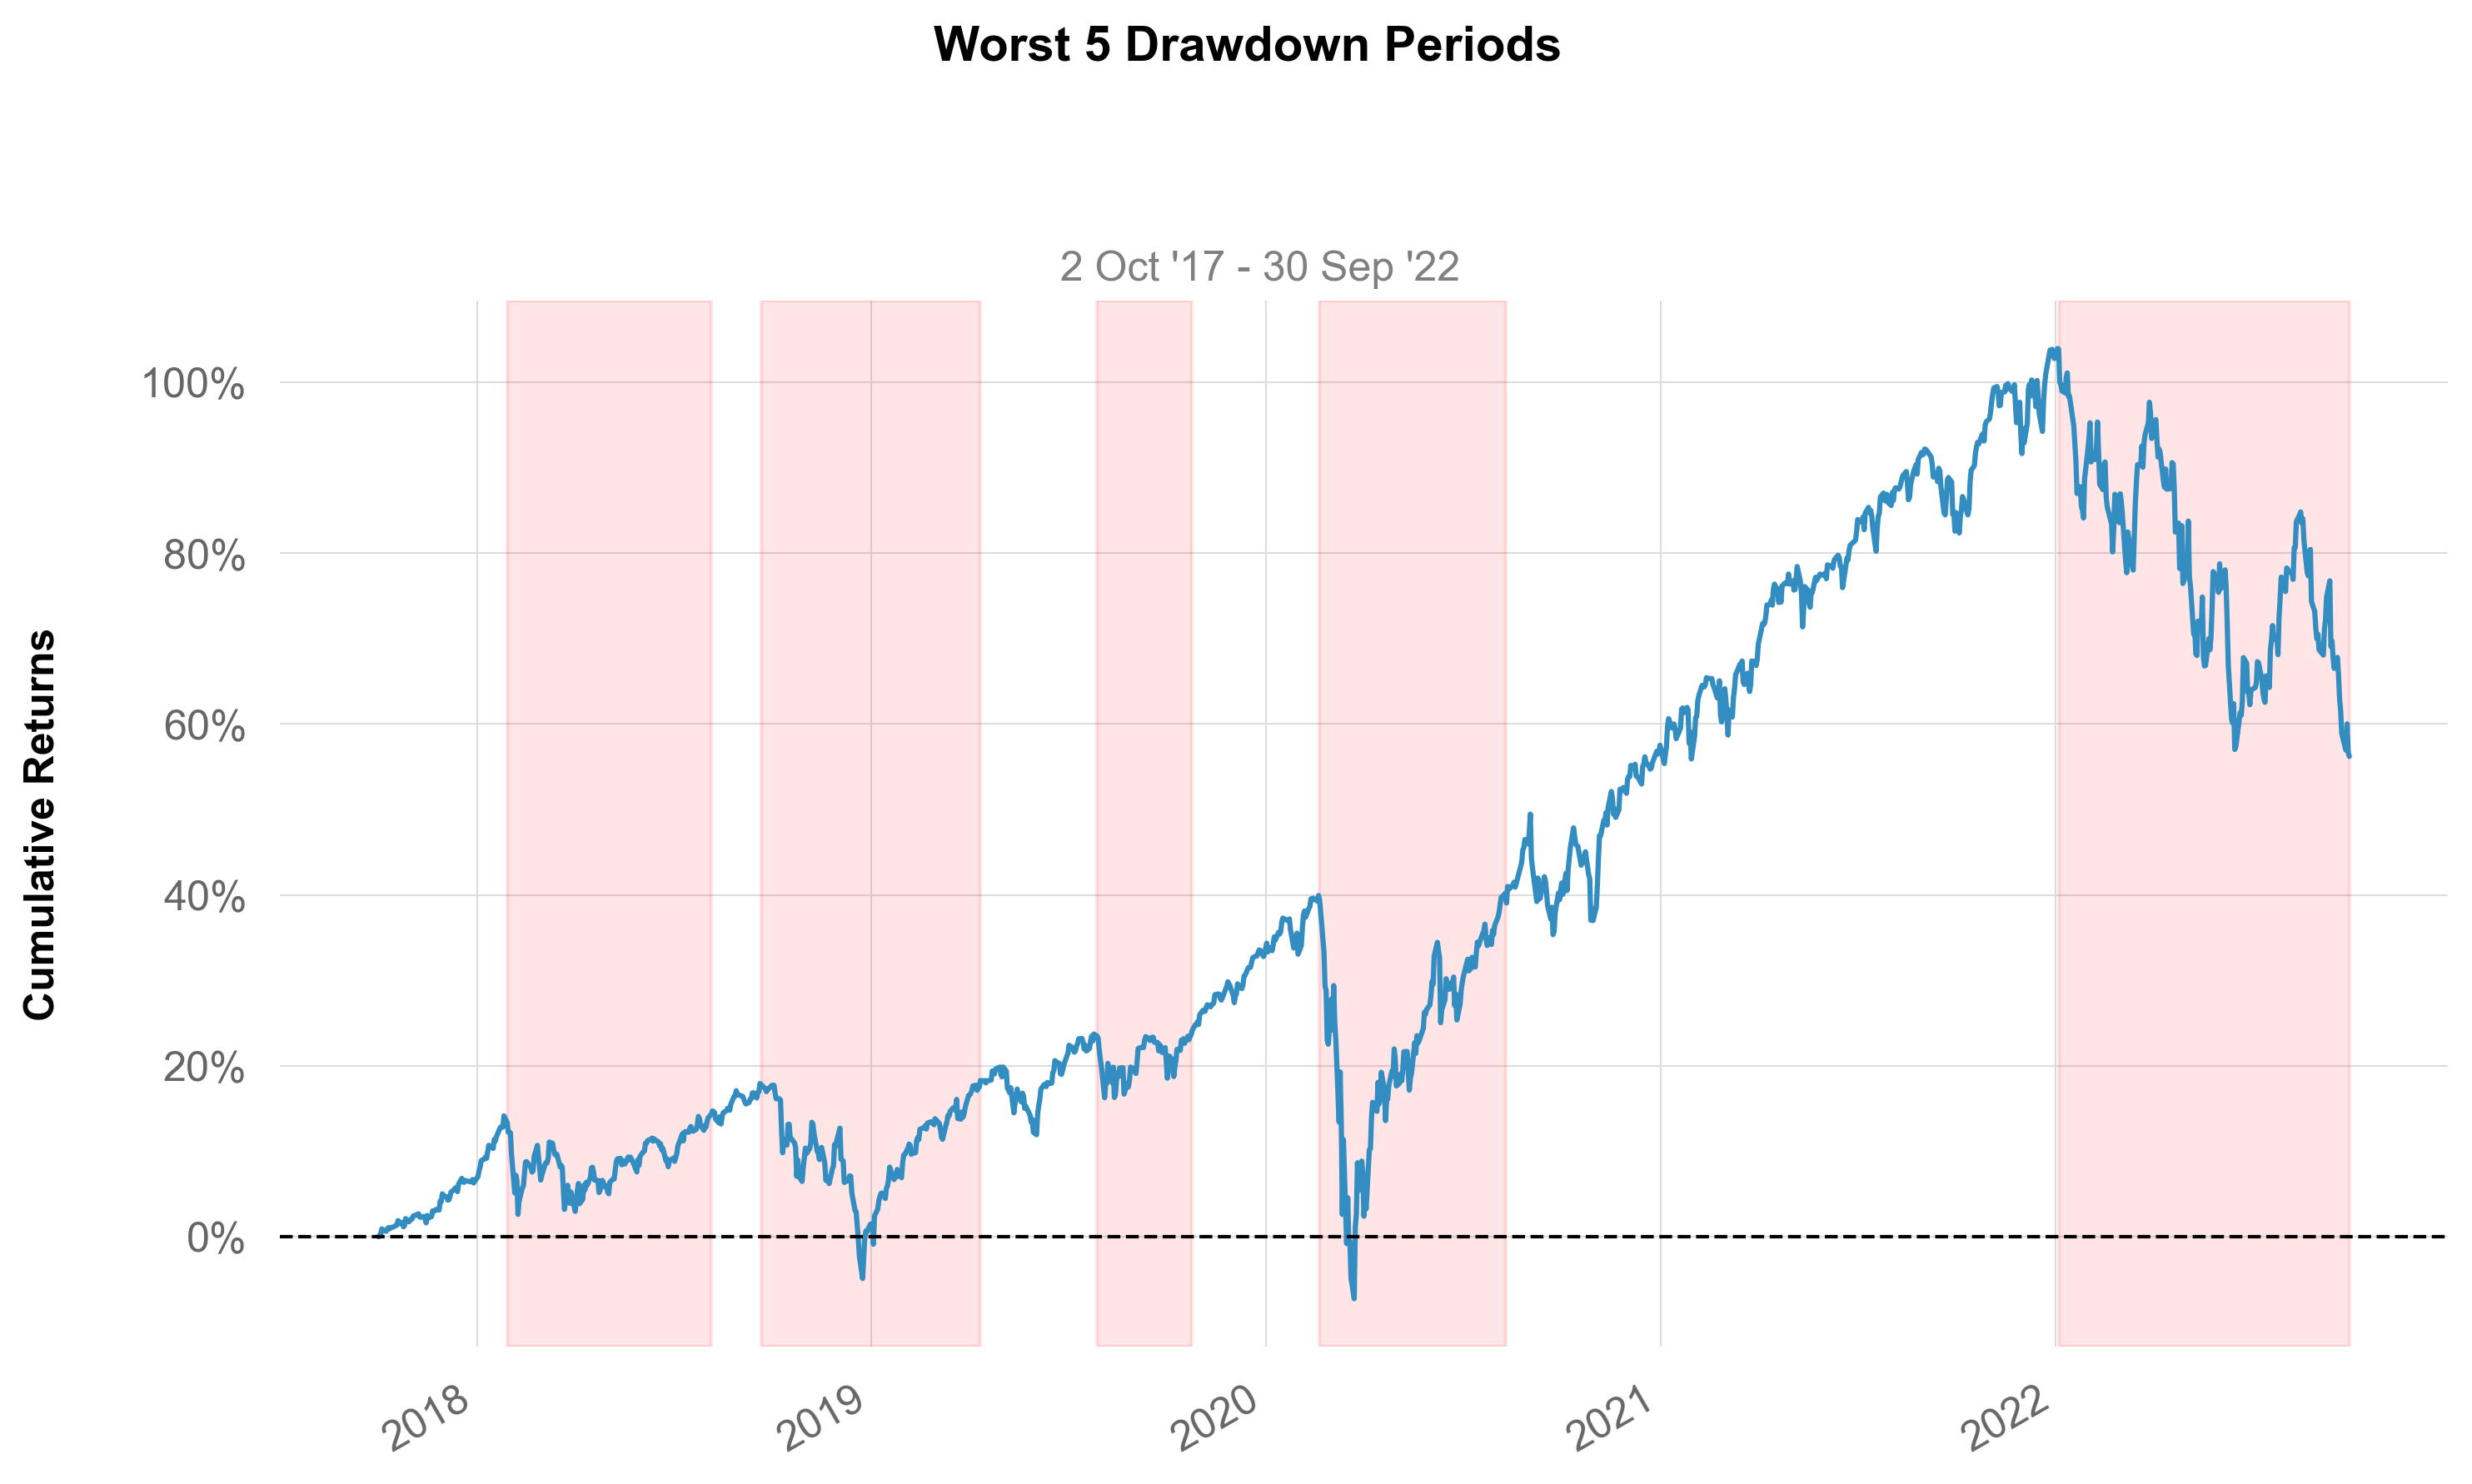
 plot_distribution (returns, figsize=(10, 6), fontname='Arial',
                    grayscale=False, ylabel=True, subtitle=True,
                    compounded=True, savefig=None, show=True)
returns = _utils.download_returns('SPY', '5y')
plot_distribution(returns)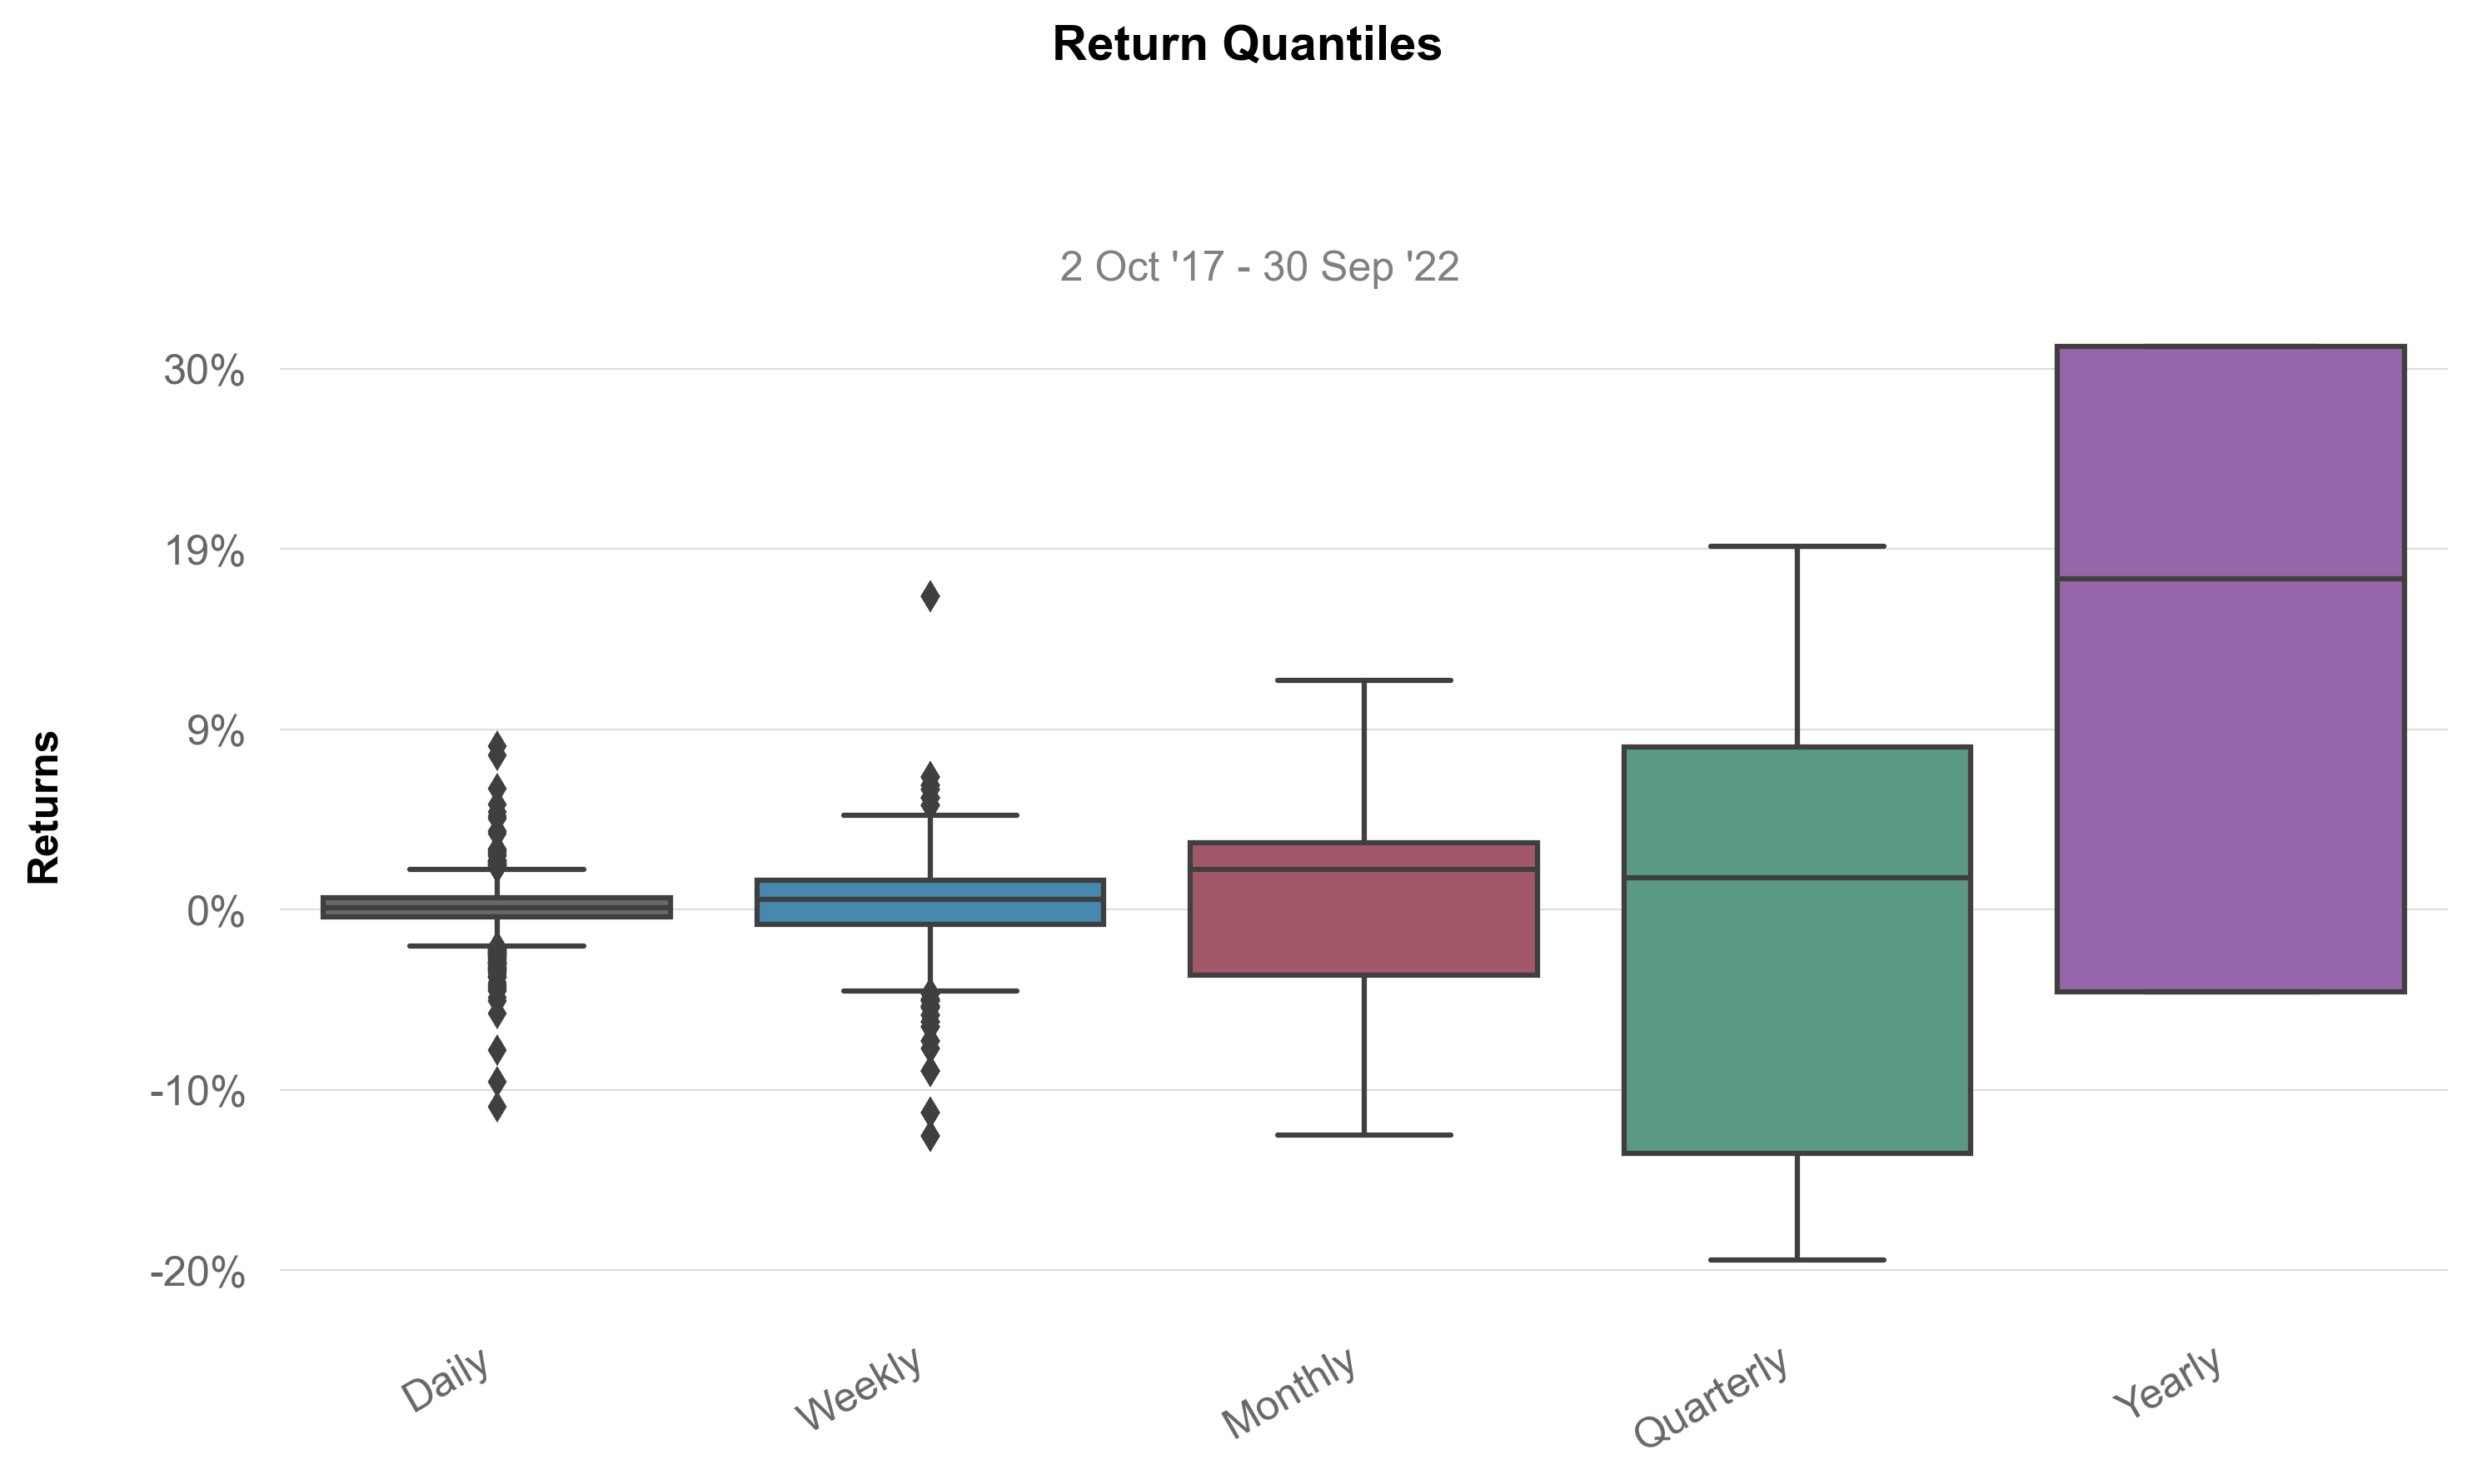
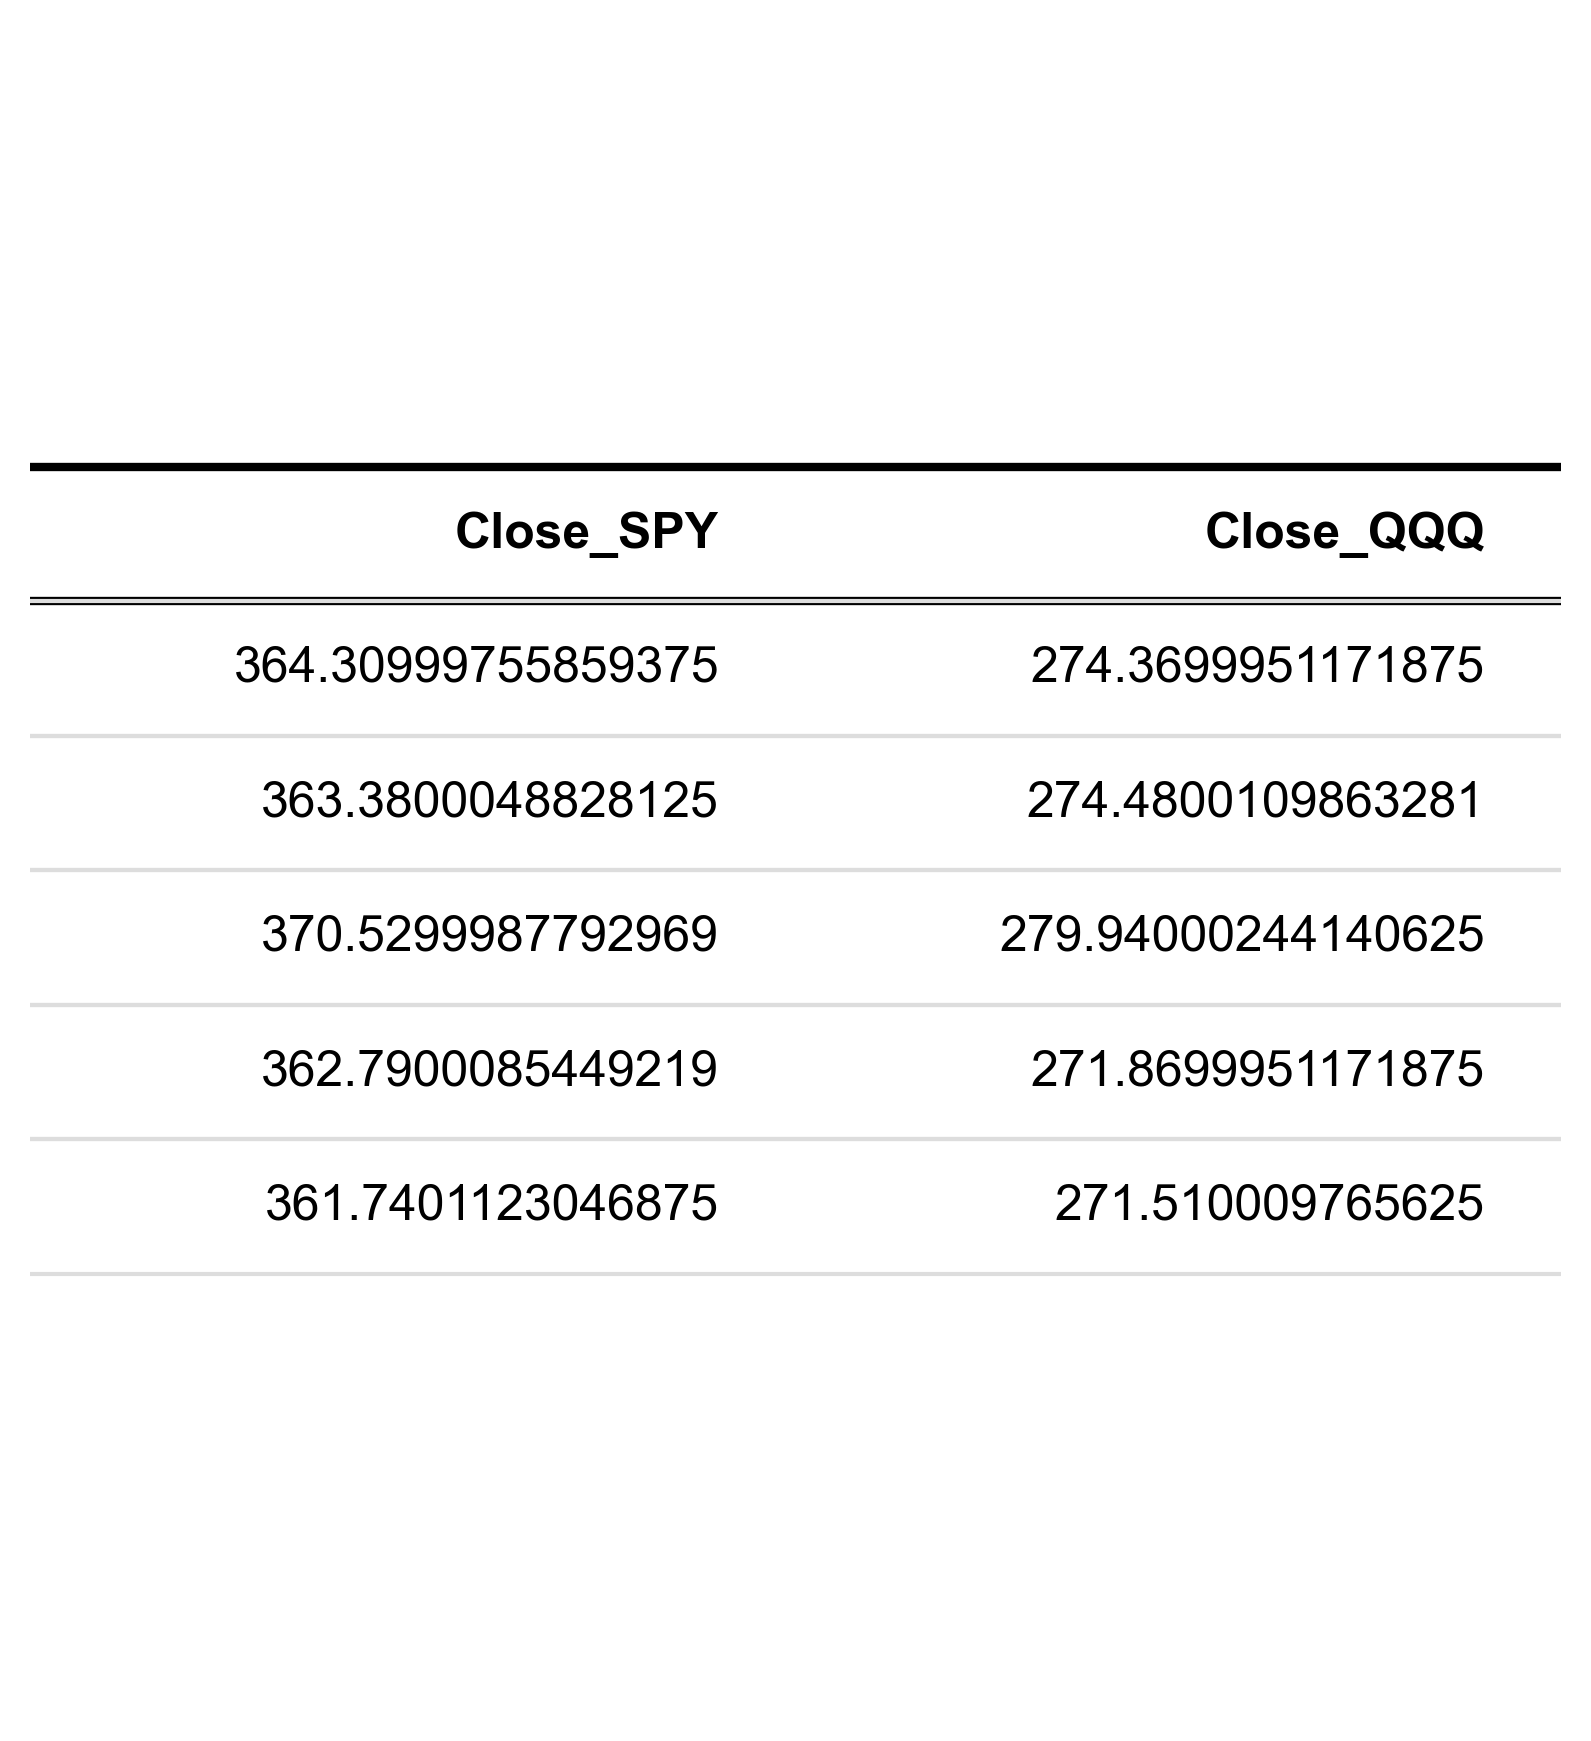
 plot_table (tbl, columns=None, title='', title_loc='left', header=True,
             colWidths=None, rowLoc='right', colLoc='right',
             colLabels=None, edges='horizontal', orient='horizontal',
             figsize=(5.5, 6), savefig=None, show=False)
value = _utils.download_prices('SPY', '5y')
becnhmark = _utils.download_prices('QQQ', '5y')
table = pd.merge(value, becnhmark, on = 'Date', suffixes = ['_SPY', '_QQQ']).tail(5)
plot_table(table)