values = _utils.download_returns('SPY', '5y')
snapshot(values)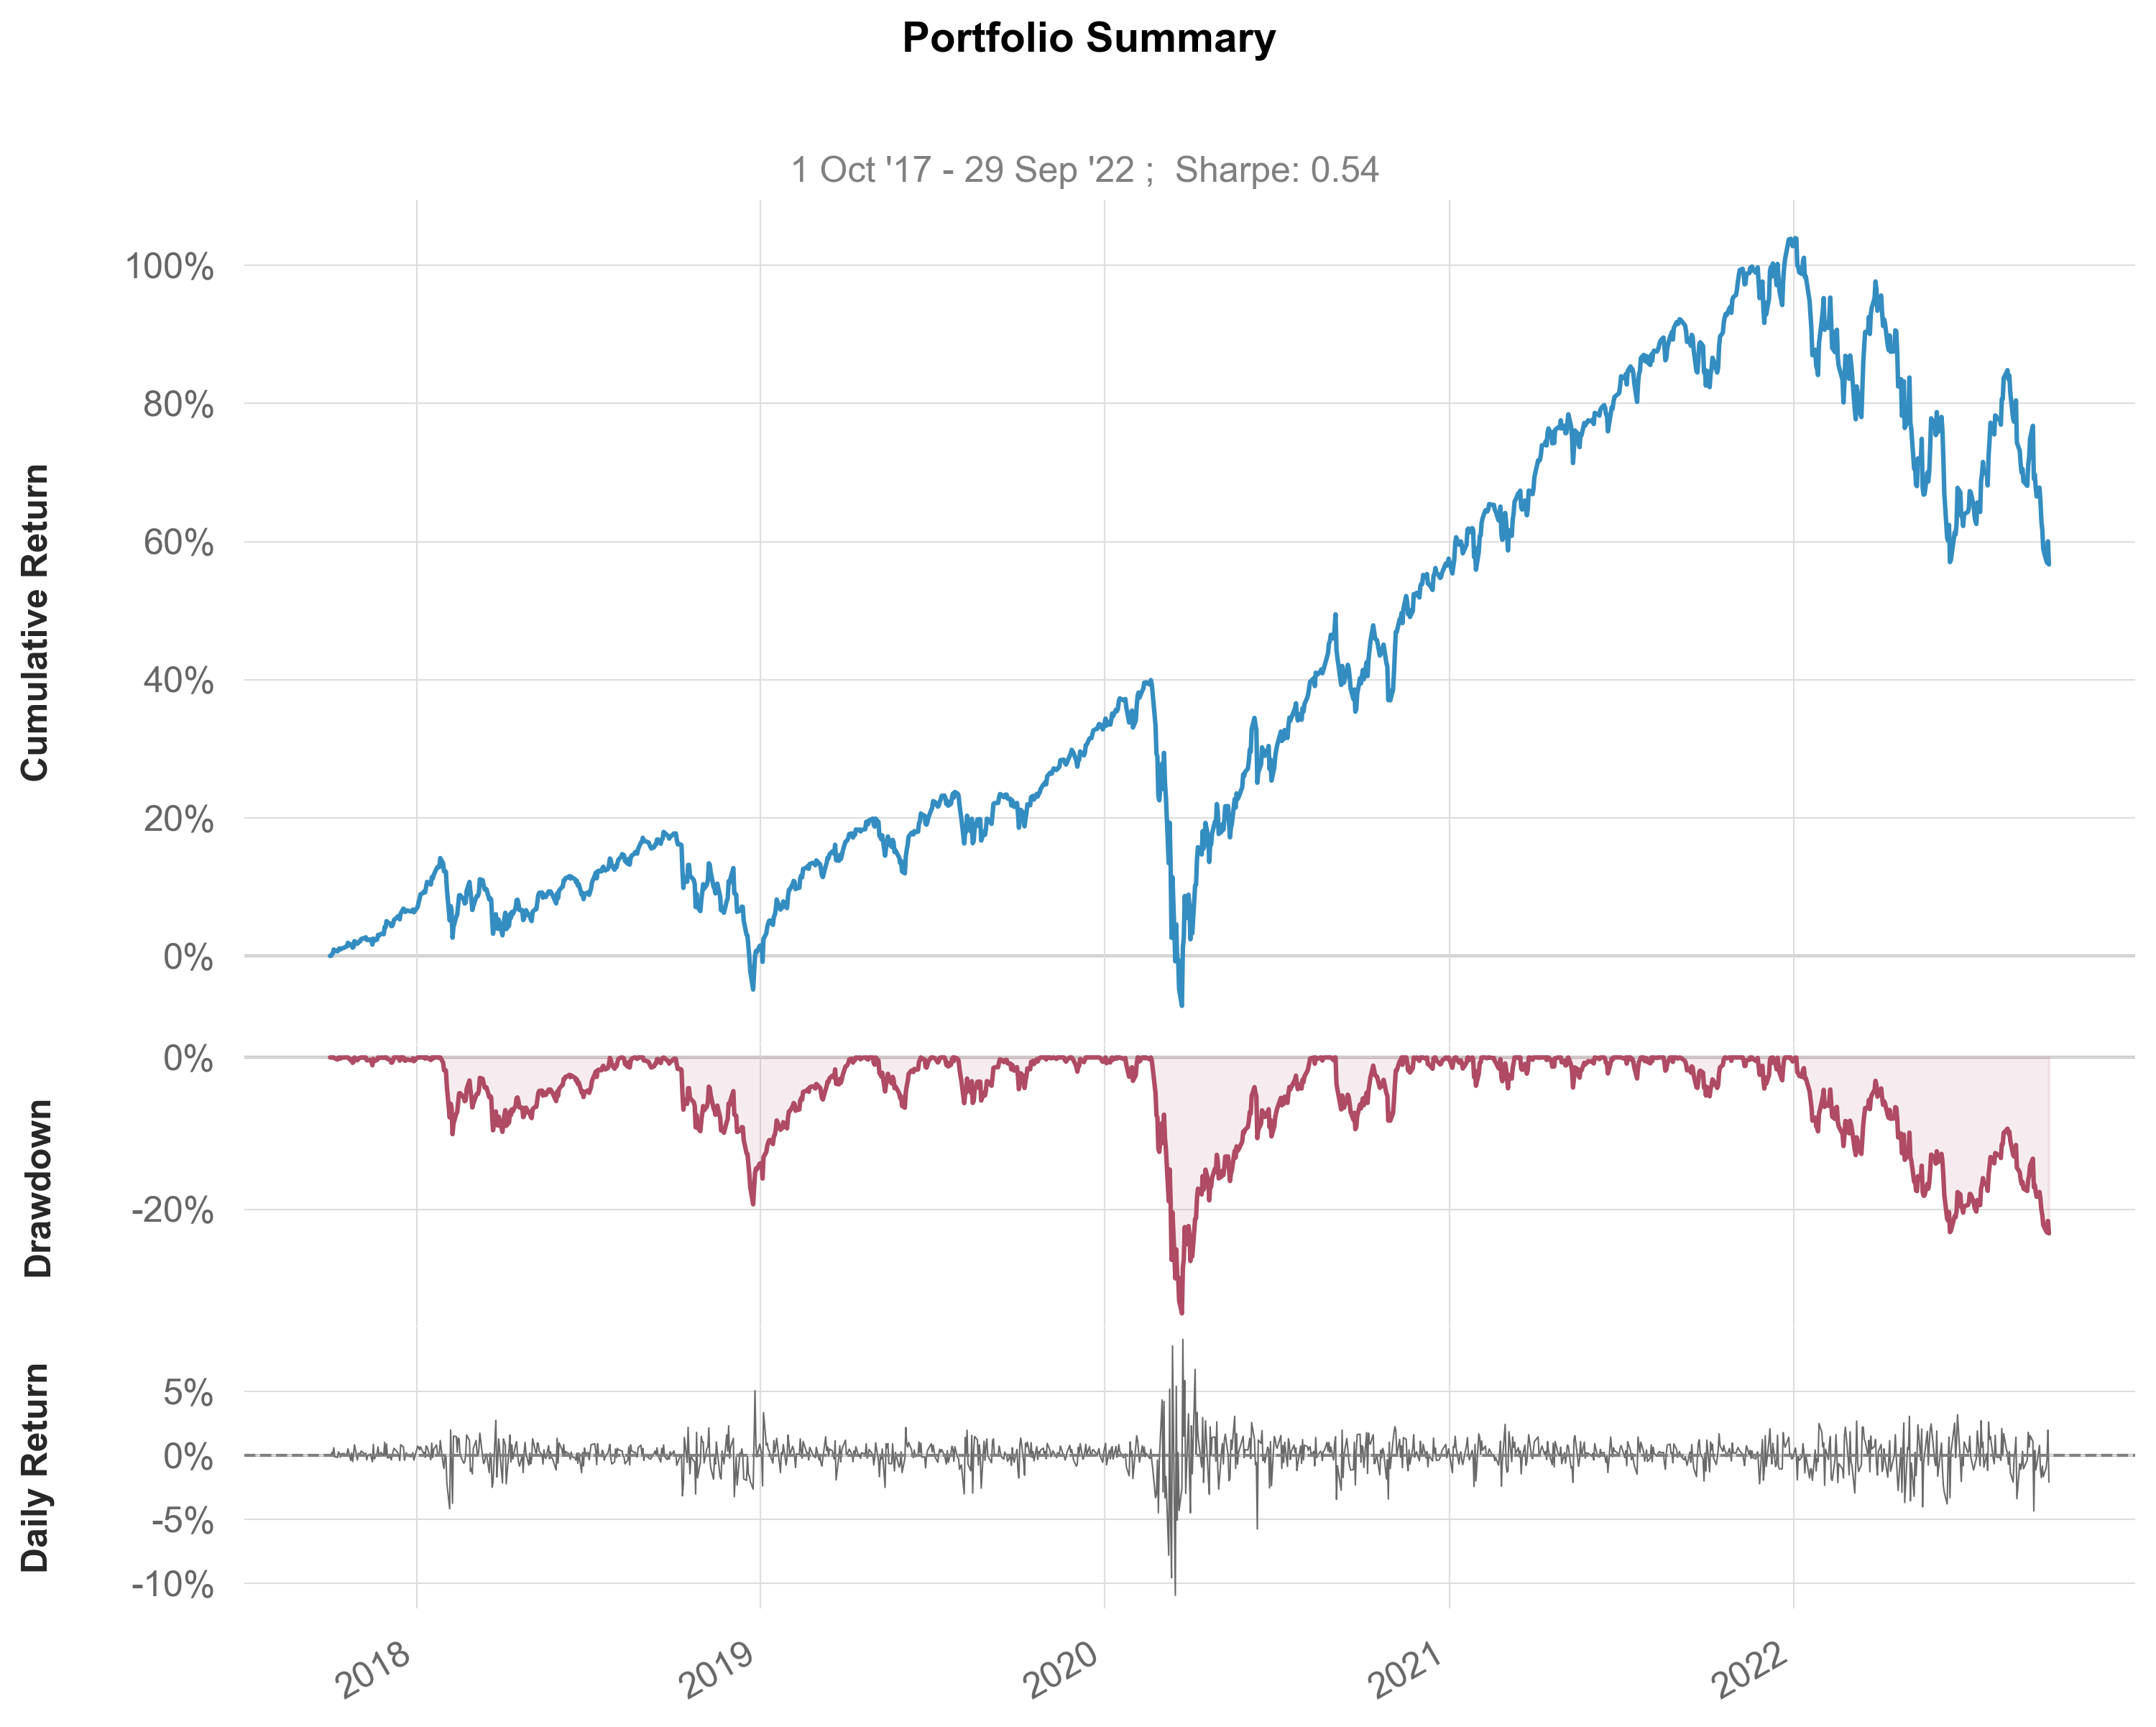
to_plotly (fig)
 snapshot (returns, grayscale=False, figsize=(10, 8), title='Portfolio
           Summary', fontname='Arial', lw=1.5, mode='comp', subtitle=True,
           savefig=None, show=True, log_scale=False)
values = _utils.download_returns('SPY', '5y')
snapshot(values)
 earnings (returns, start_balance=100000.0, mode='comp', grayscale=False,
           figsize=(10, 6), title='Portfolio Earnings', fontname='Arial',
           lw=1.5, subtitle=True, savefig=None, show=True)
values = _utils.download_returns('SPY', '5y')
earnings(values)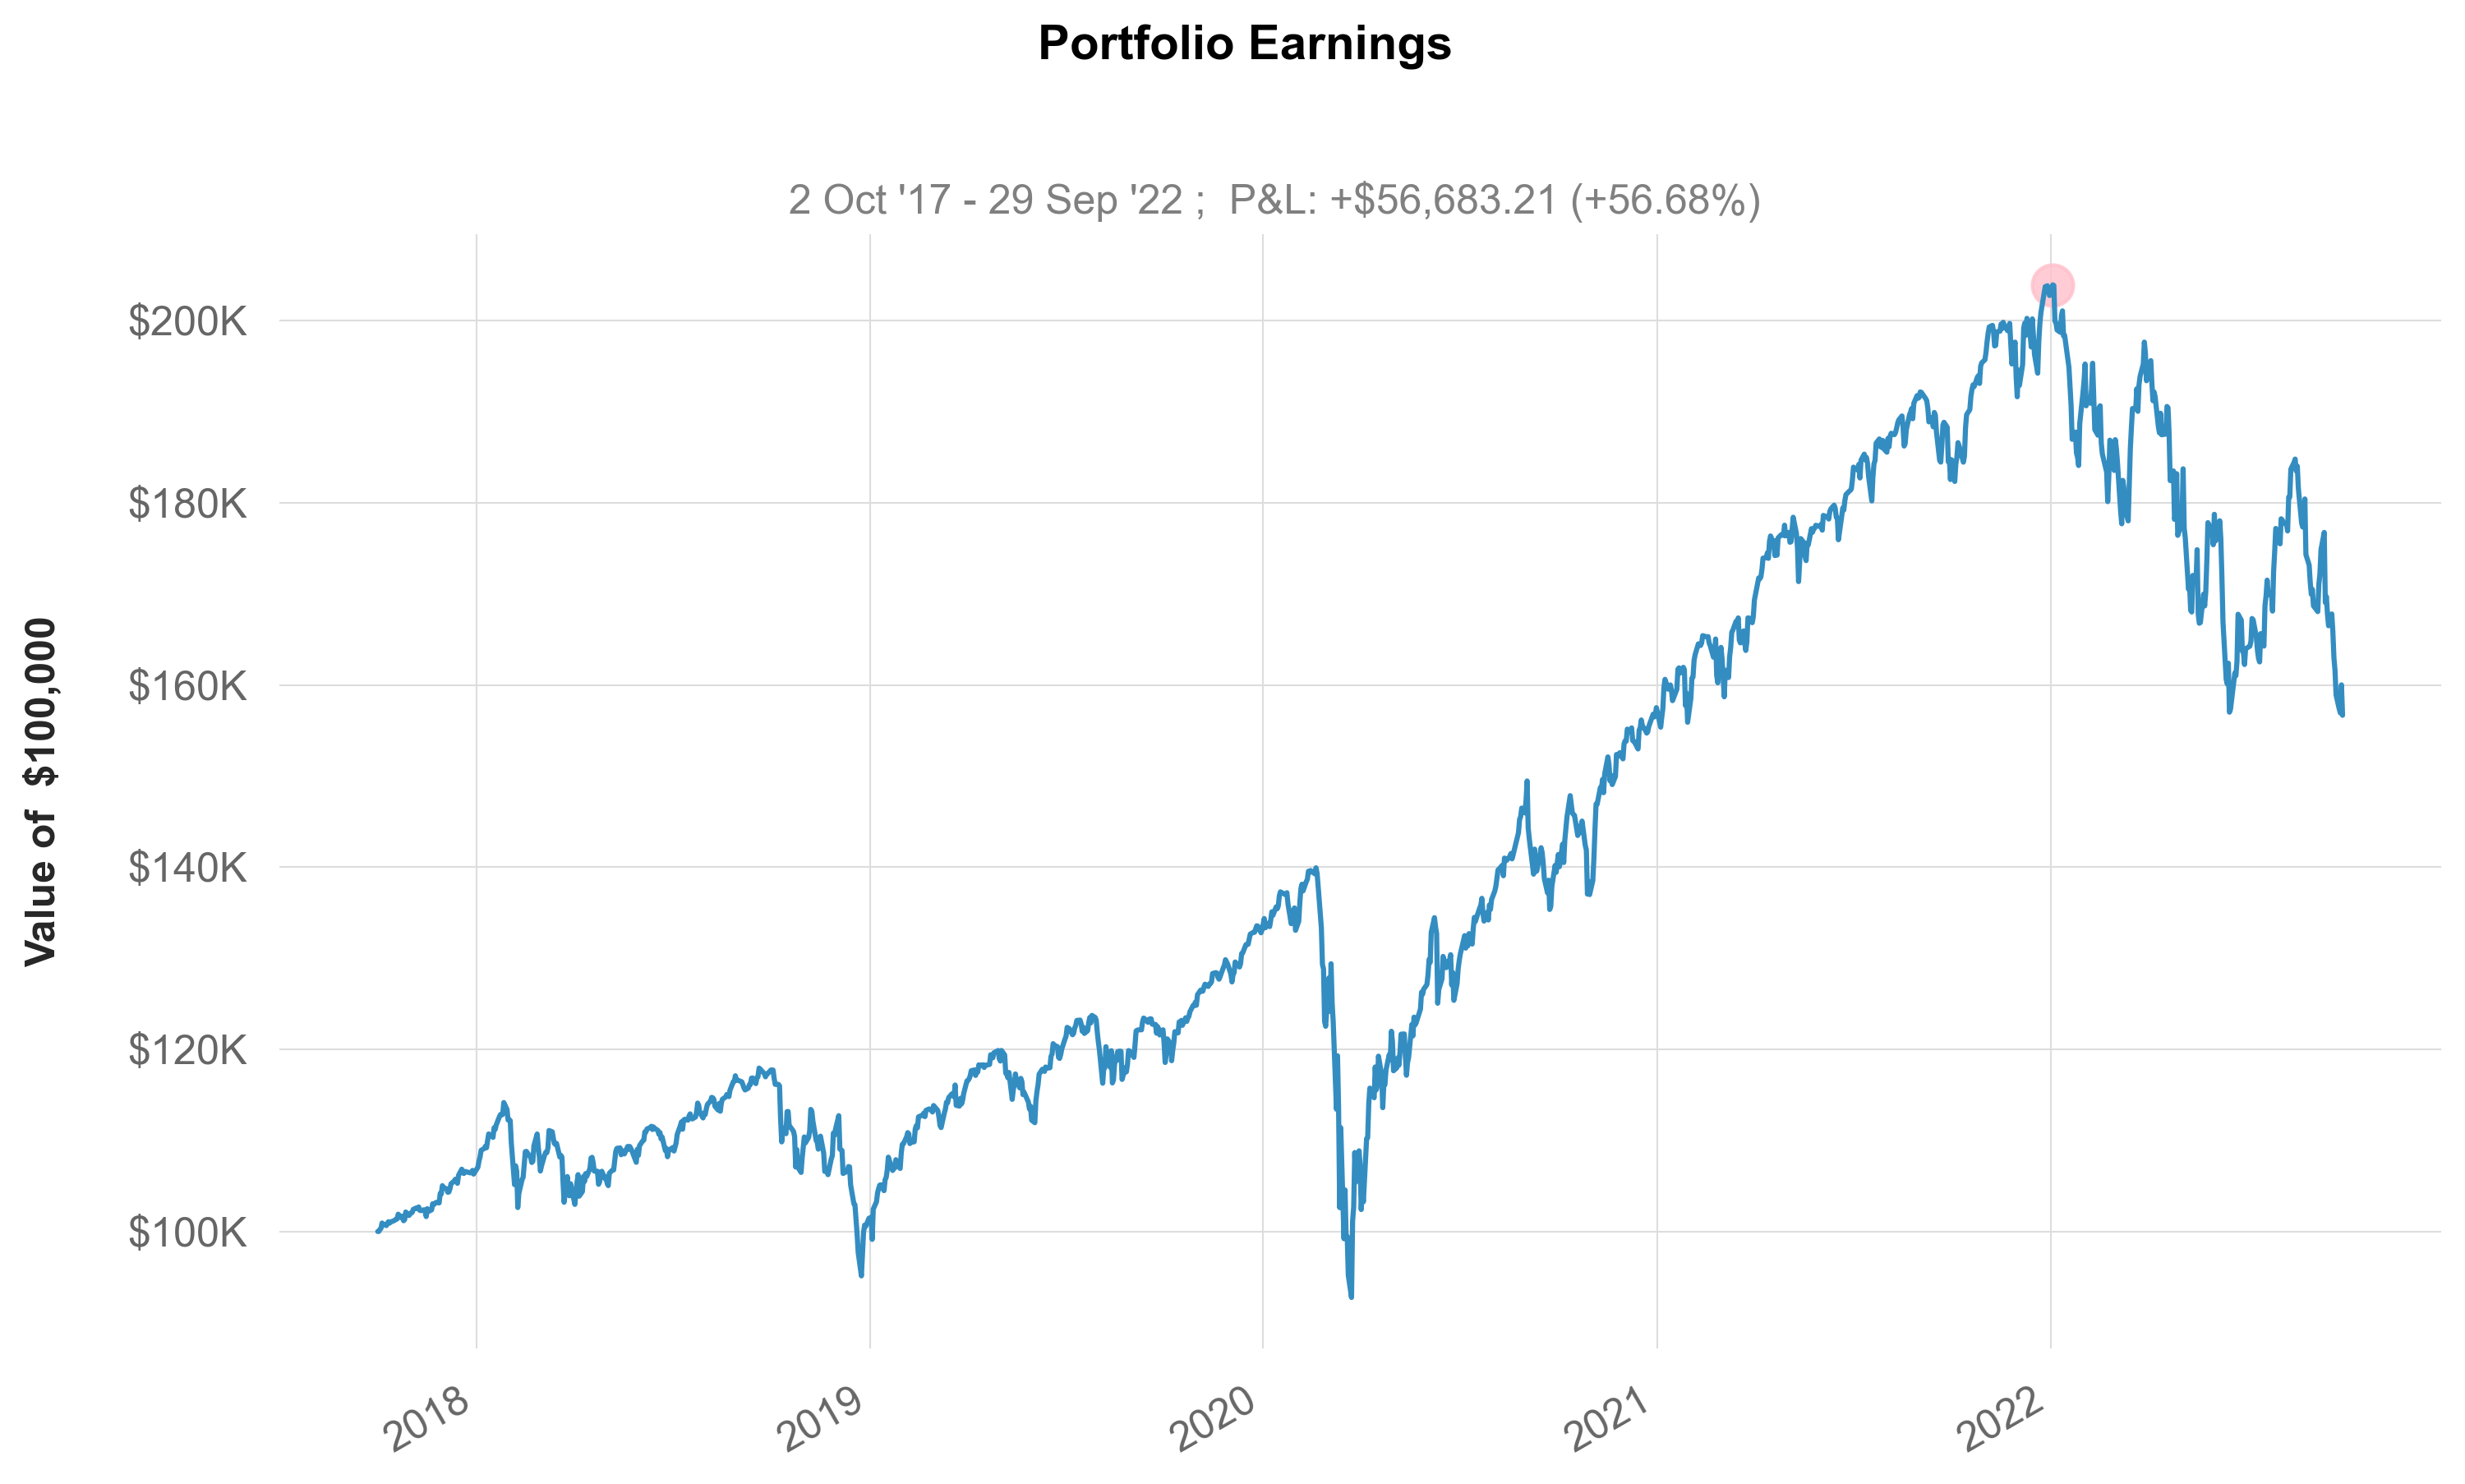
 returns (returns, benchmark=None, grayscale=False, figsize=(10, 6),
          returns_label='Strategy', benchmark_label='Benchmark',
          fontname='Arial', lw=1.5, match_volatility=False, compound=True,
          cumulative=True, resample=None, ylabel='Cumulative Returns',
          subtitle=True, savefig=None, show=True, prepare_returns=False)
values = _utils.download_returns('SPY', '5y')
benchmark = _utils.download_returns('QQQ', '5y')
returns(values, benchmark, returns_label="SPY", benchmark_label="QQQ")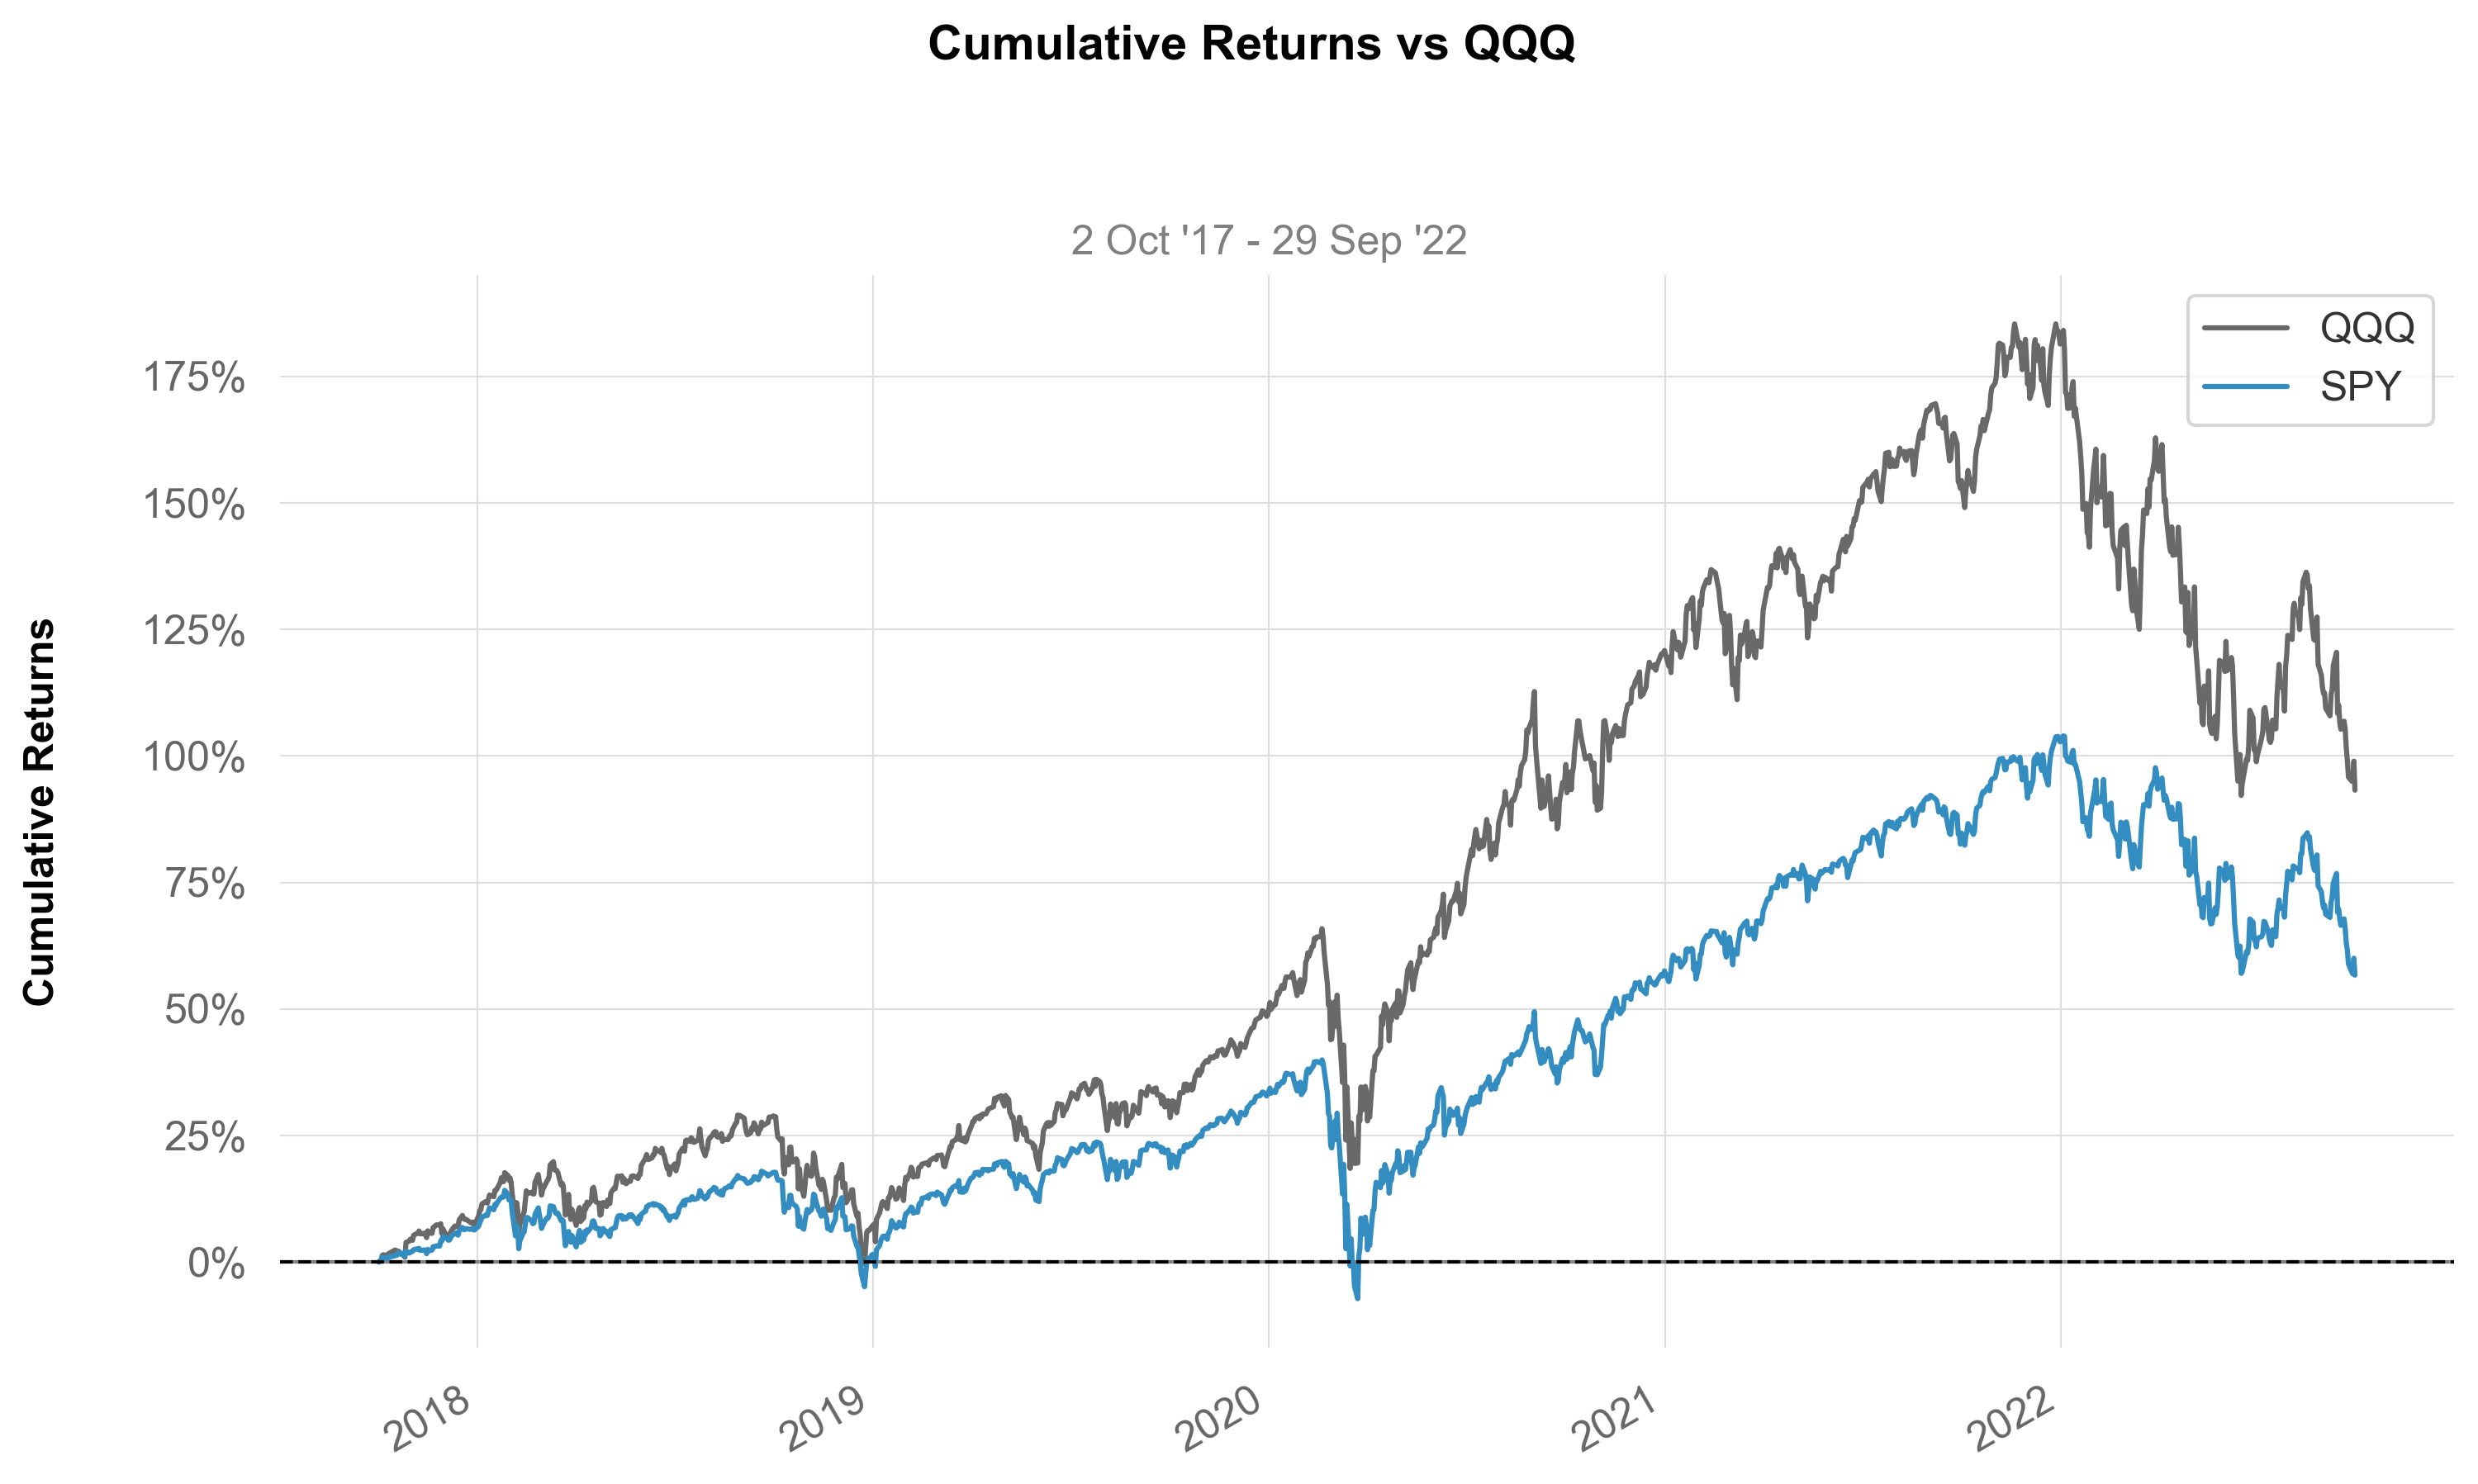
 daily_returns (returns, grayscale=False, figsize=(10, 4),
                fontname='Arial', lw=0.5, log_scale=False,
                ylabel='Returns', subtitle=True, savefig=None, show=True,
                prepare_returns=True)
 log_returns (returns, benchmark=None, grayscale=False, figsize=(10, 5),
              returns_label='Strategy', benchmark_label='Benchmark',
              fontname='Arial', lw=1.5, match_volatility=False,
              compound=True, cumulative=True, resample=None,
              ylabel='Cumulative Returns', subtitle=True, savefig=None,
              show=True, prepare_returns=False)
values = _utils.download_returns('SPY', '5y')
benchmark = _utils.download_returns('QQQ', '5y')
log_returns(values, benchmark, returns_label="SPY", benchmark_label="QQQ")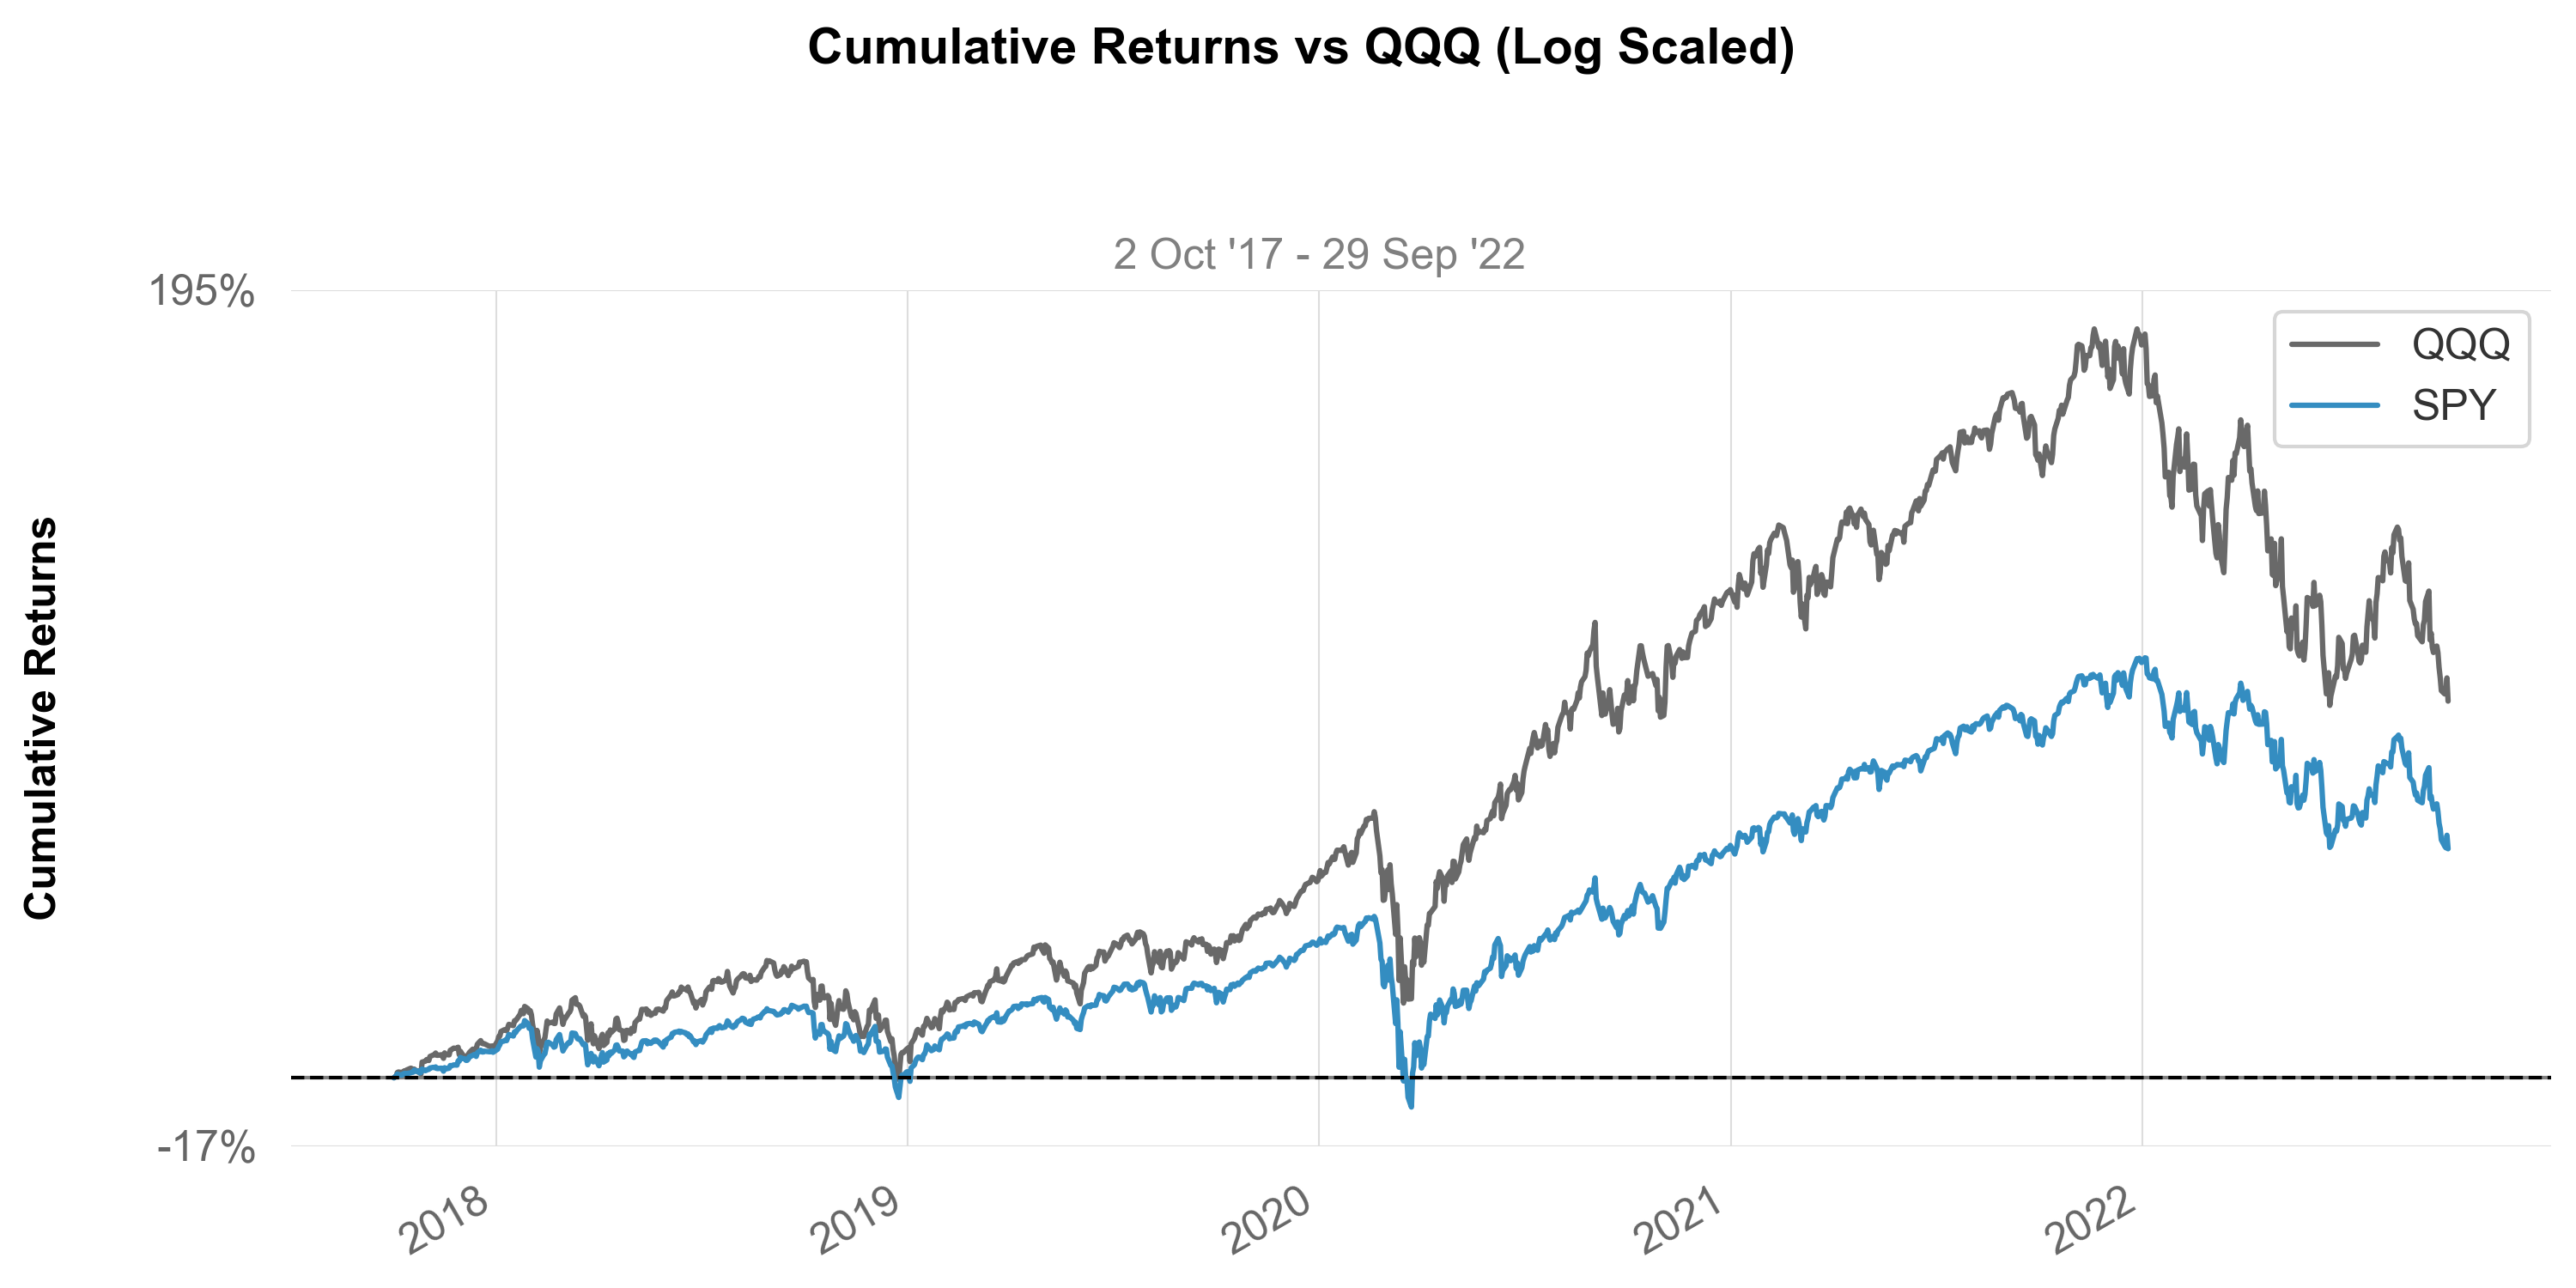
 yearly_returns (returns, benchmark=None, returns_label='Strategy',
                 benchmark_label='Benchmark', fontname='Arial',
                 grayscale=False, hlw=1.5, hlcolor='red', hllabel='',
                 match_volatility=False, log_scale=False, figsize=(10, 5),
                 ylabel=True, subtitle=True, compounded=True,
                 savefig=None, show=True, prepare_returns=True)
values = _utils.download_returns('SPY', '5y')
benchmark = _utils.download_returns('QQQ', '5y')
yearly_returns(values, benchmark, returns_label="SPY", benchmark_label="QQQ")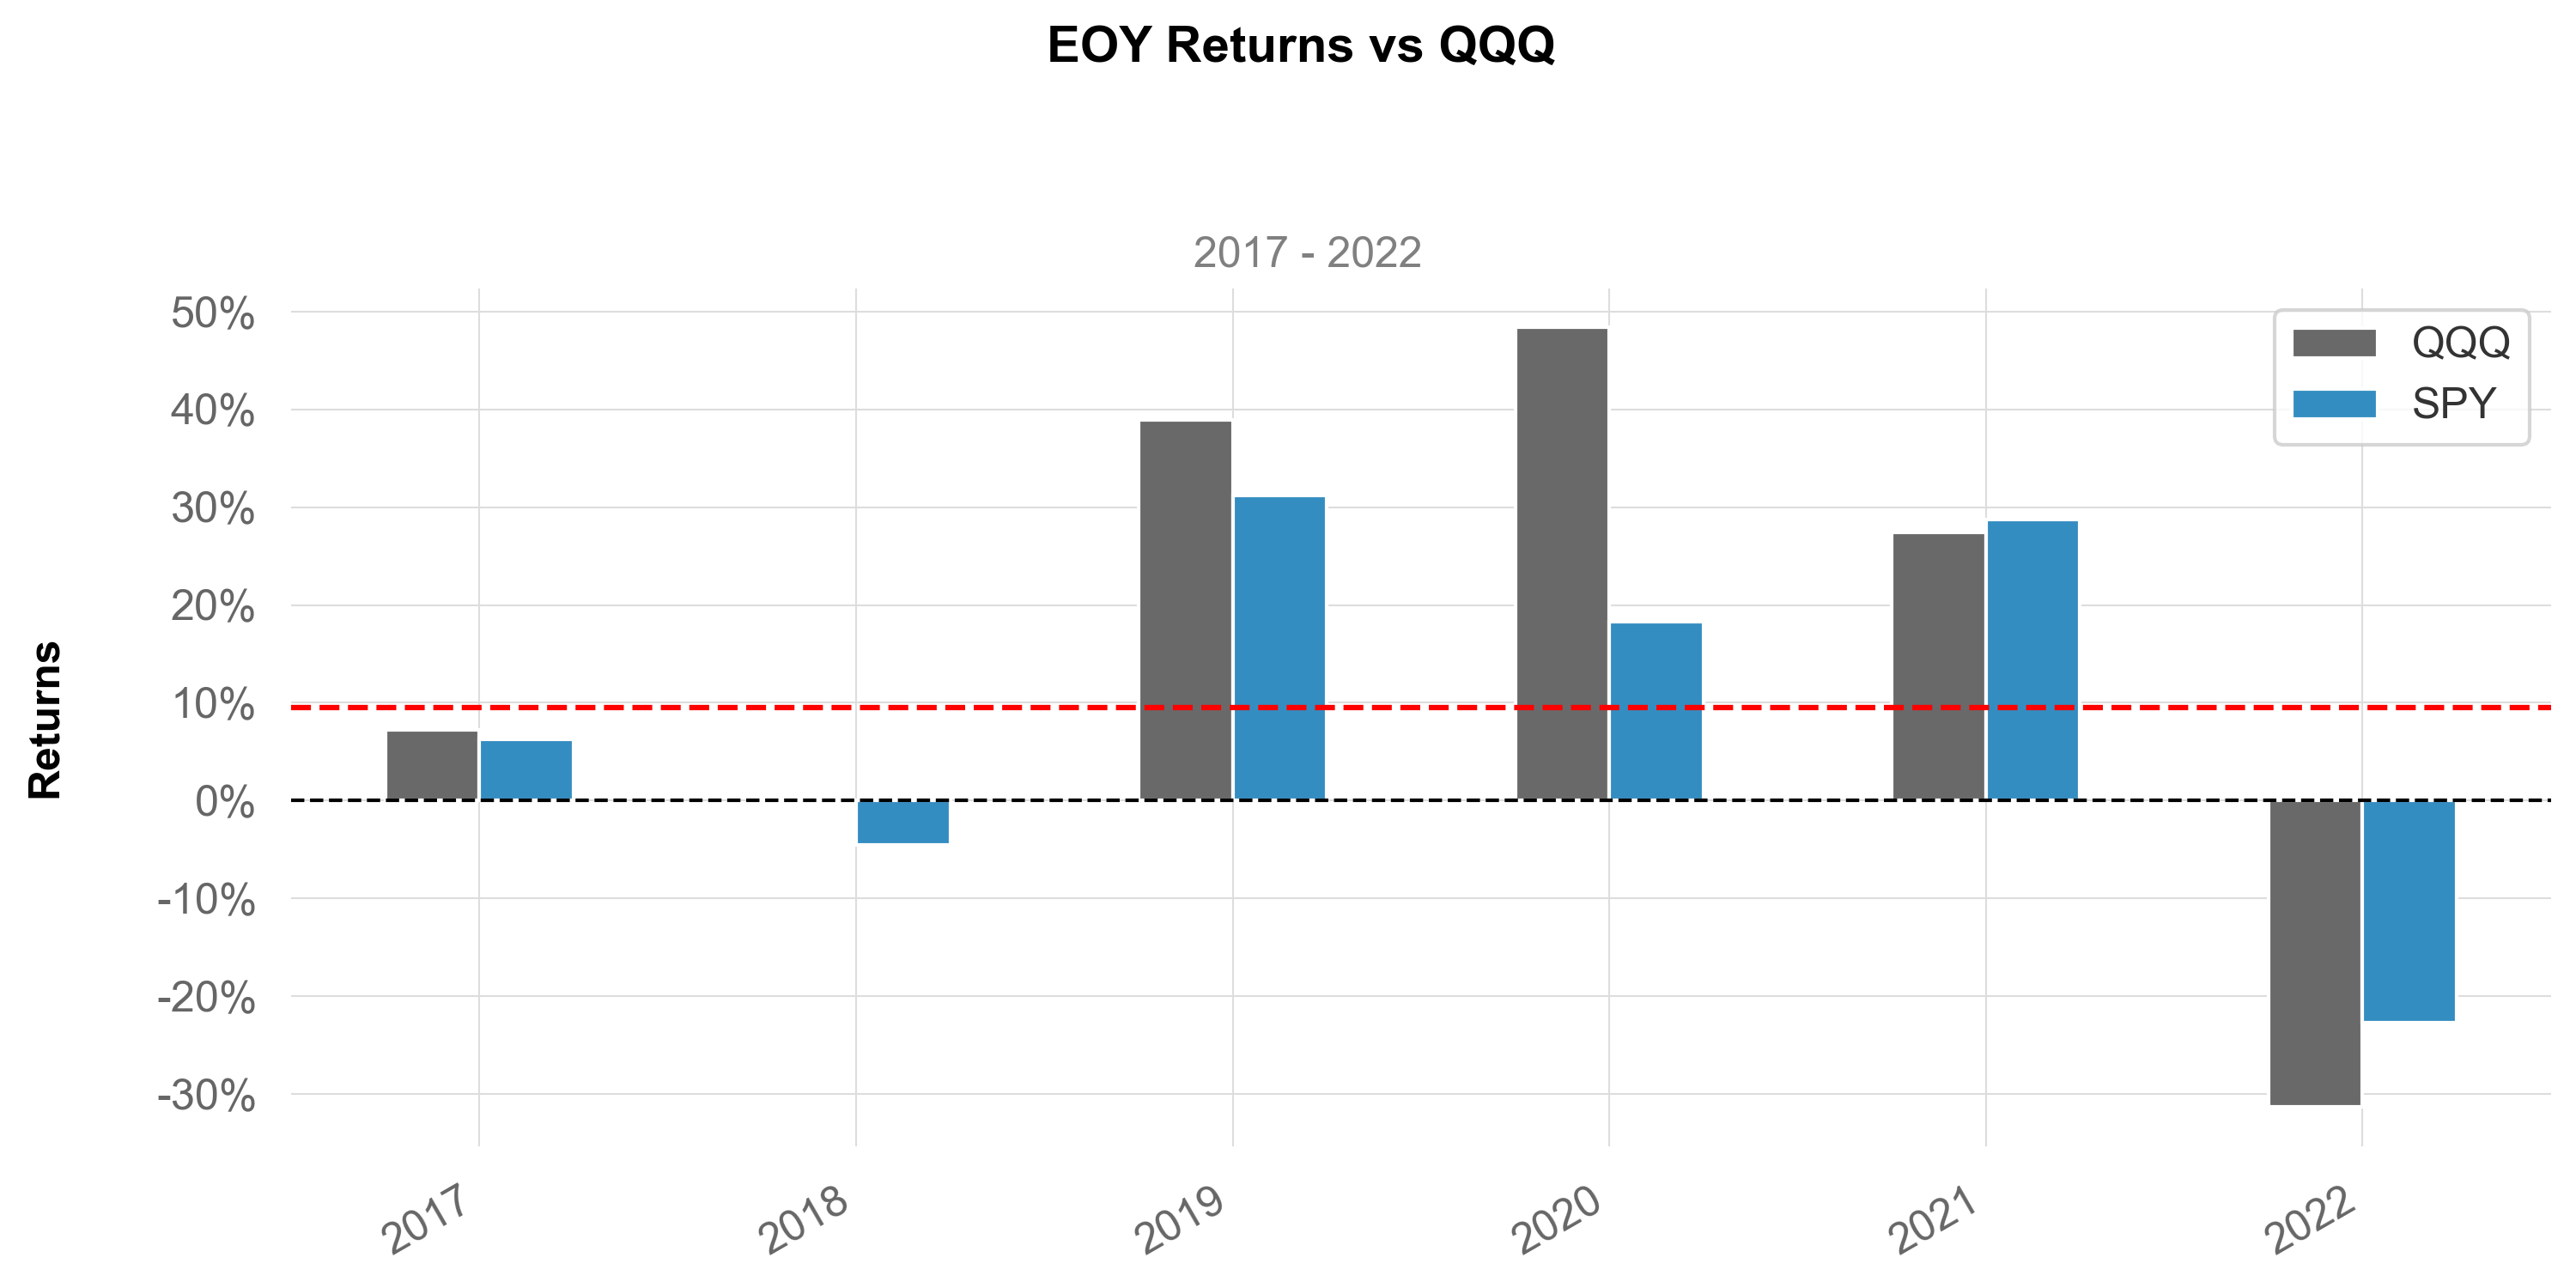
 distribution (returns, fontname='Arial', grayscale=False, ylabel=True,
               figsize=(10, 6), subtitle=True, compounded=True,
               savefig=None, show=True, prepare_returns=True)
values = _utils.download_returns('SPY', '5y')
distribution(values)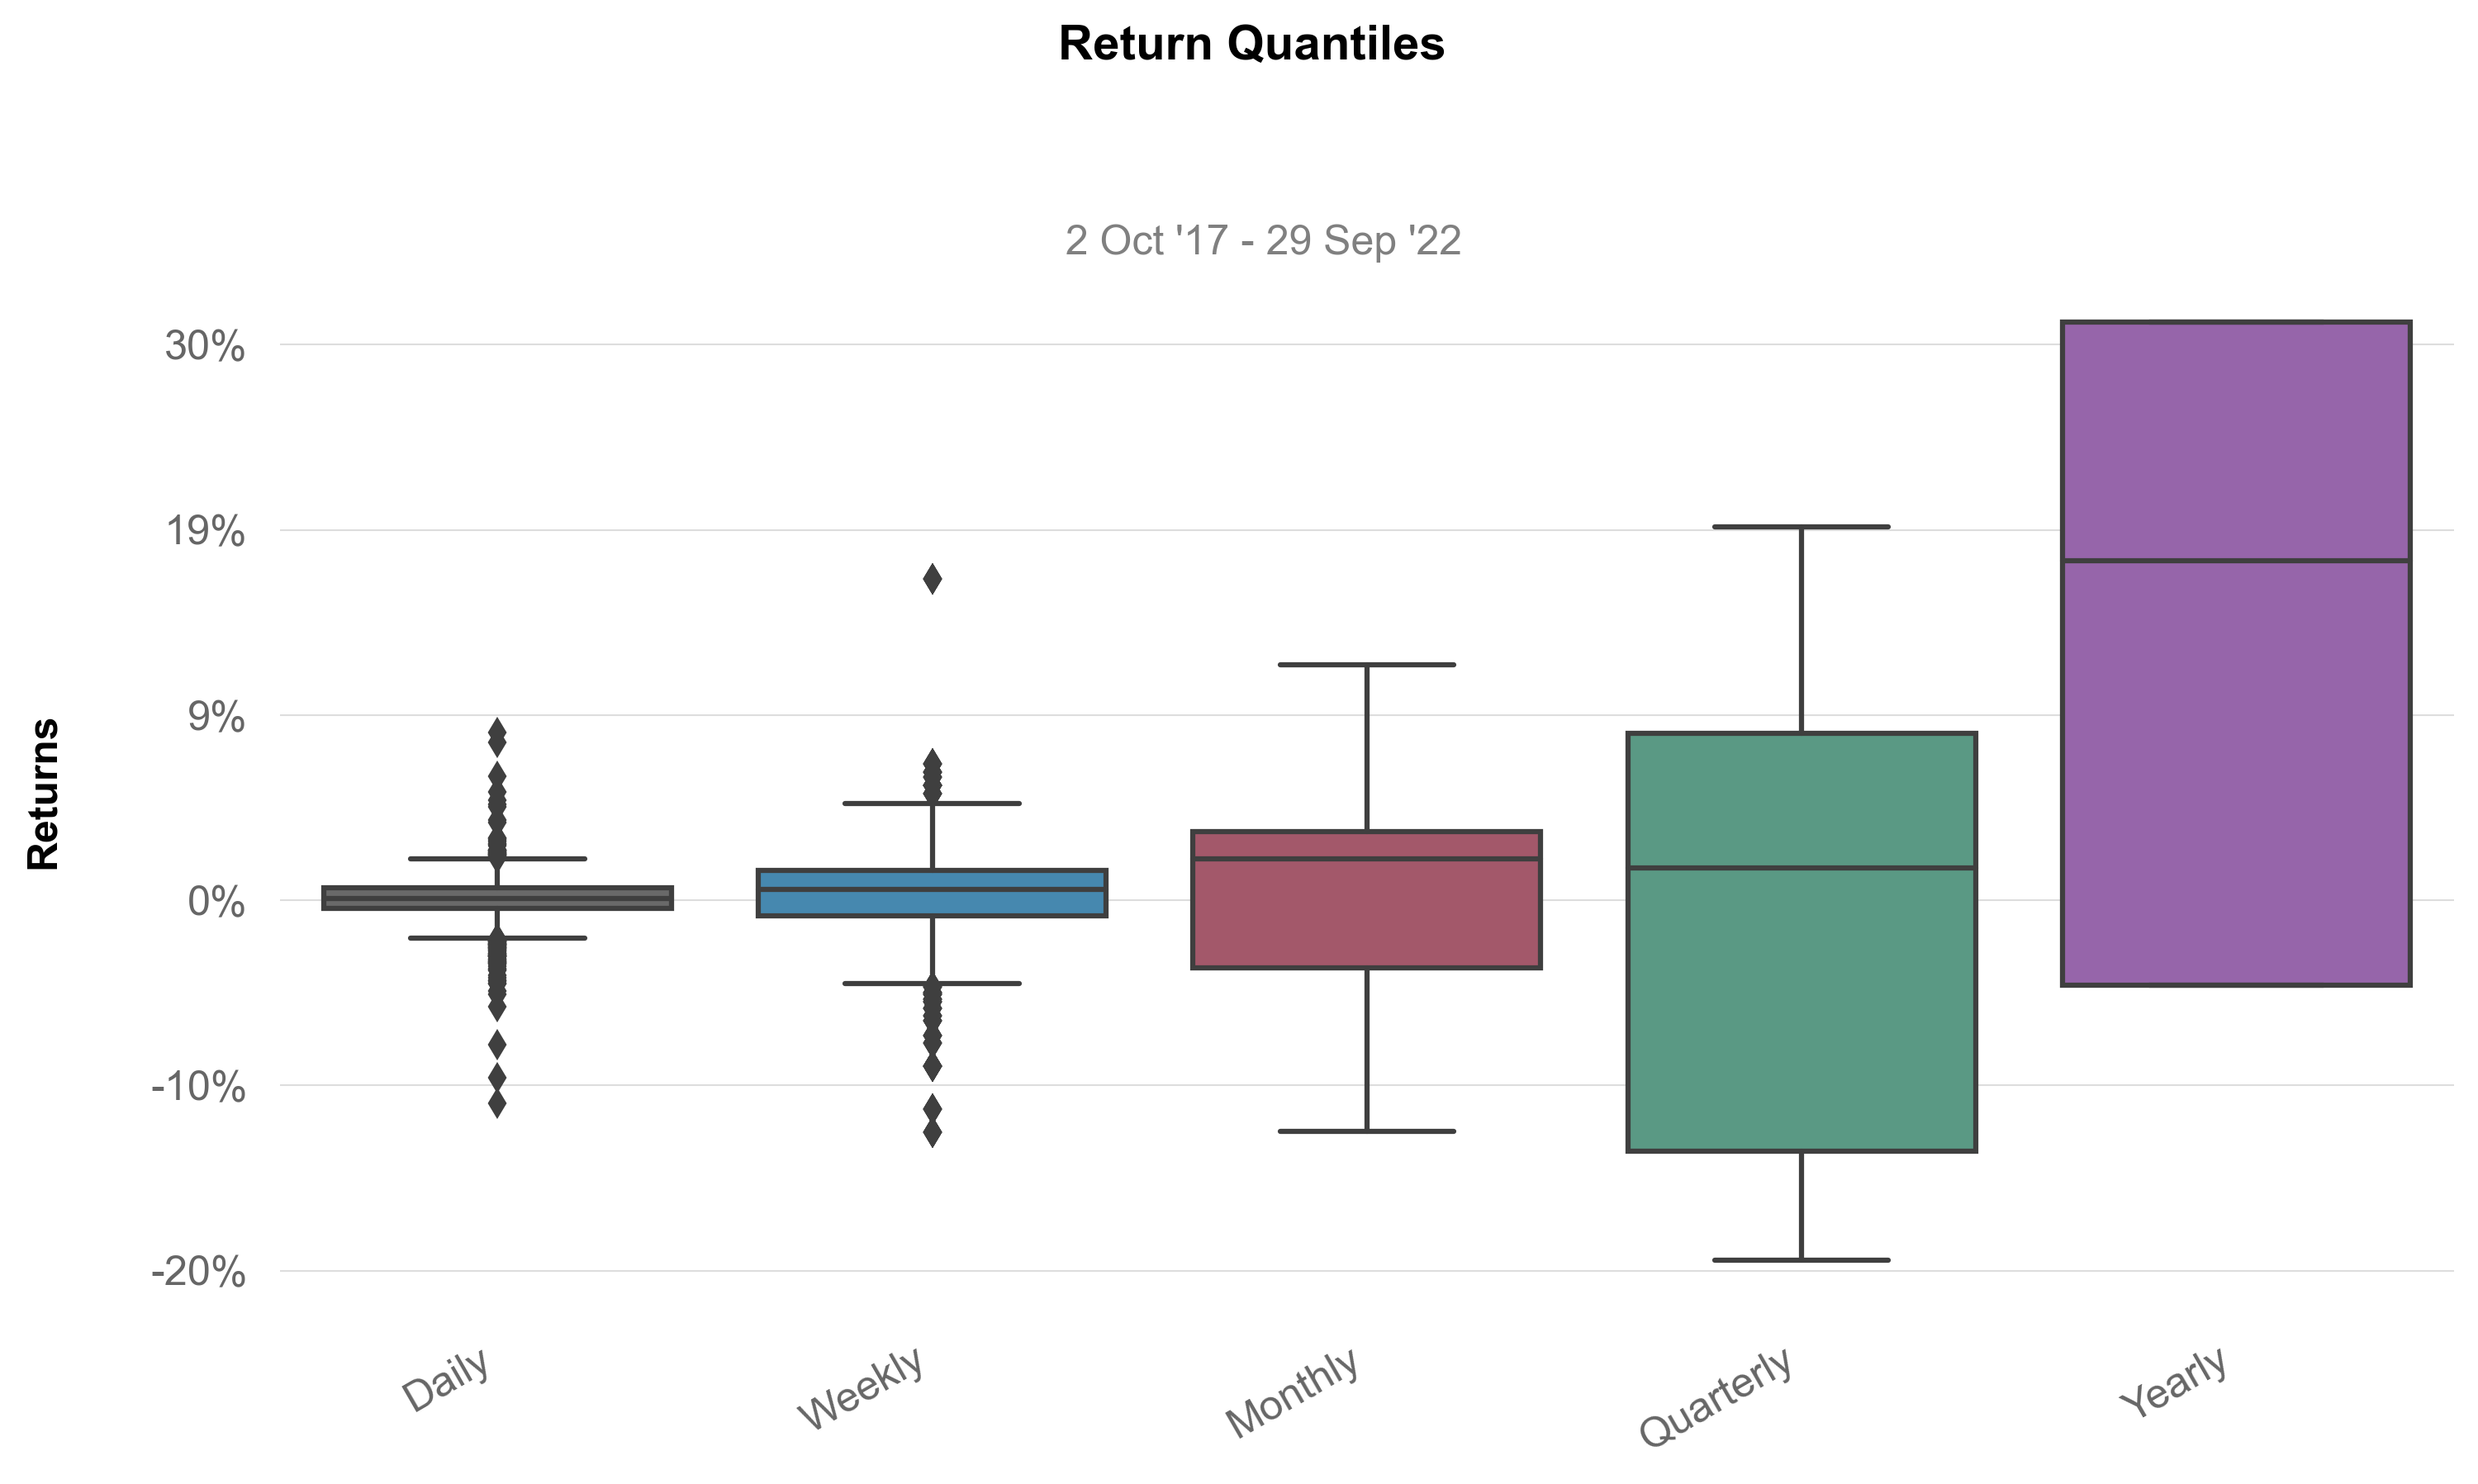
 histogram (returns, resample='M', fontname='Arial', grayscale=False,
            figsize=(10, 5), ylabel=True, subtitle=True, compounded=True,
            savefig=None, show=True, prepare_returns=True)
values = _utils.download_returns('SPY', '5y')
histogram(values)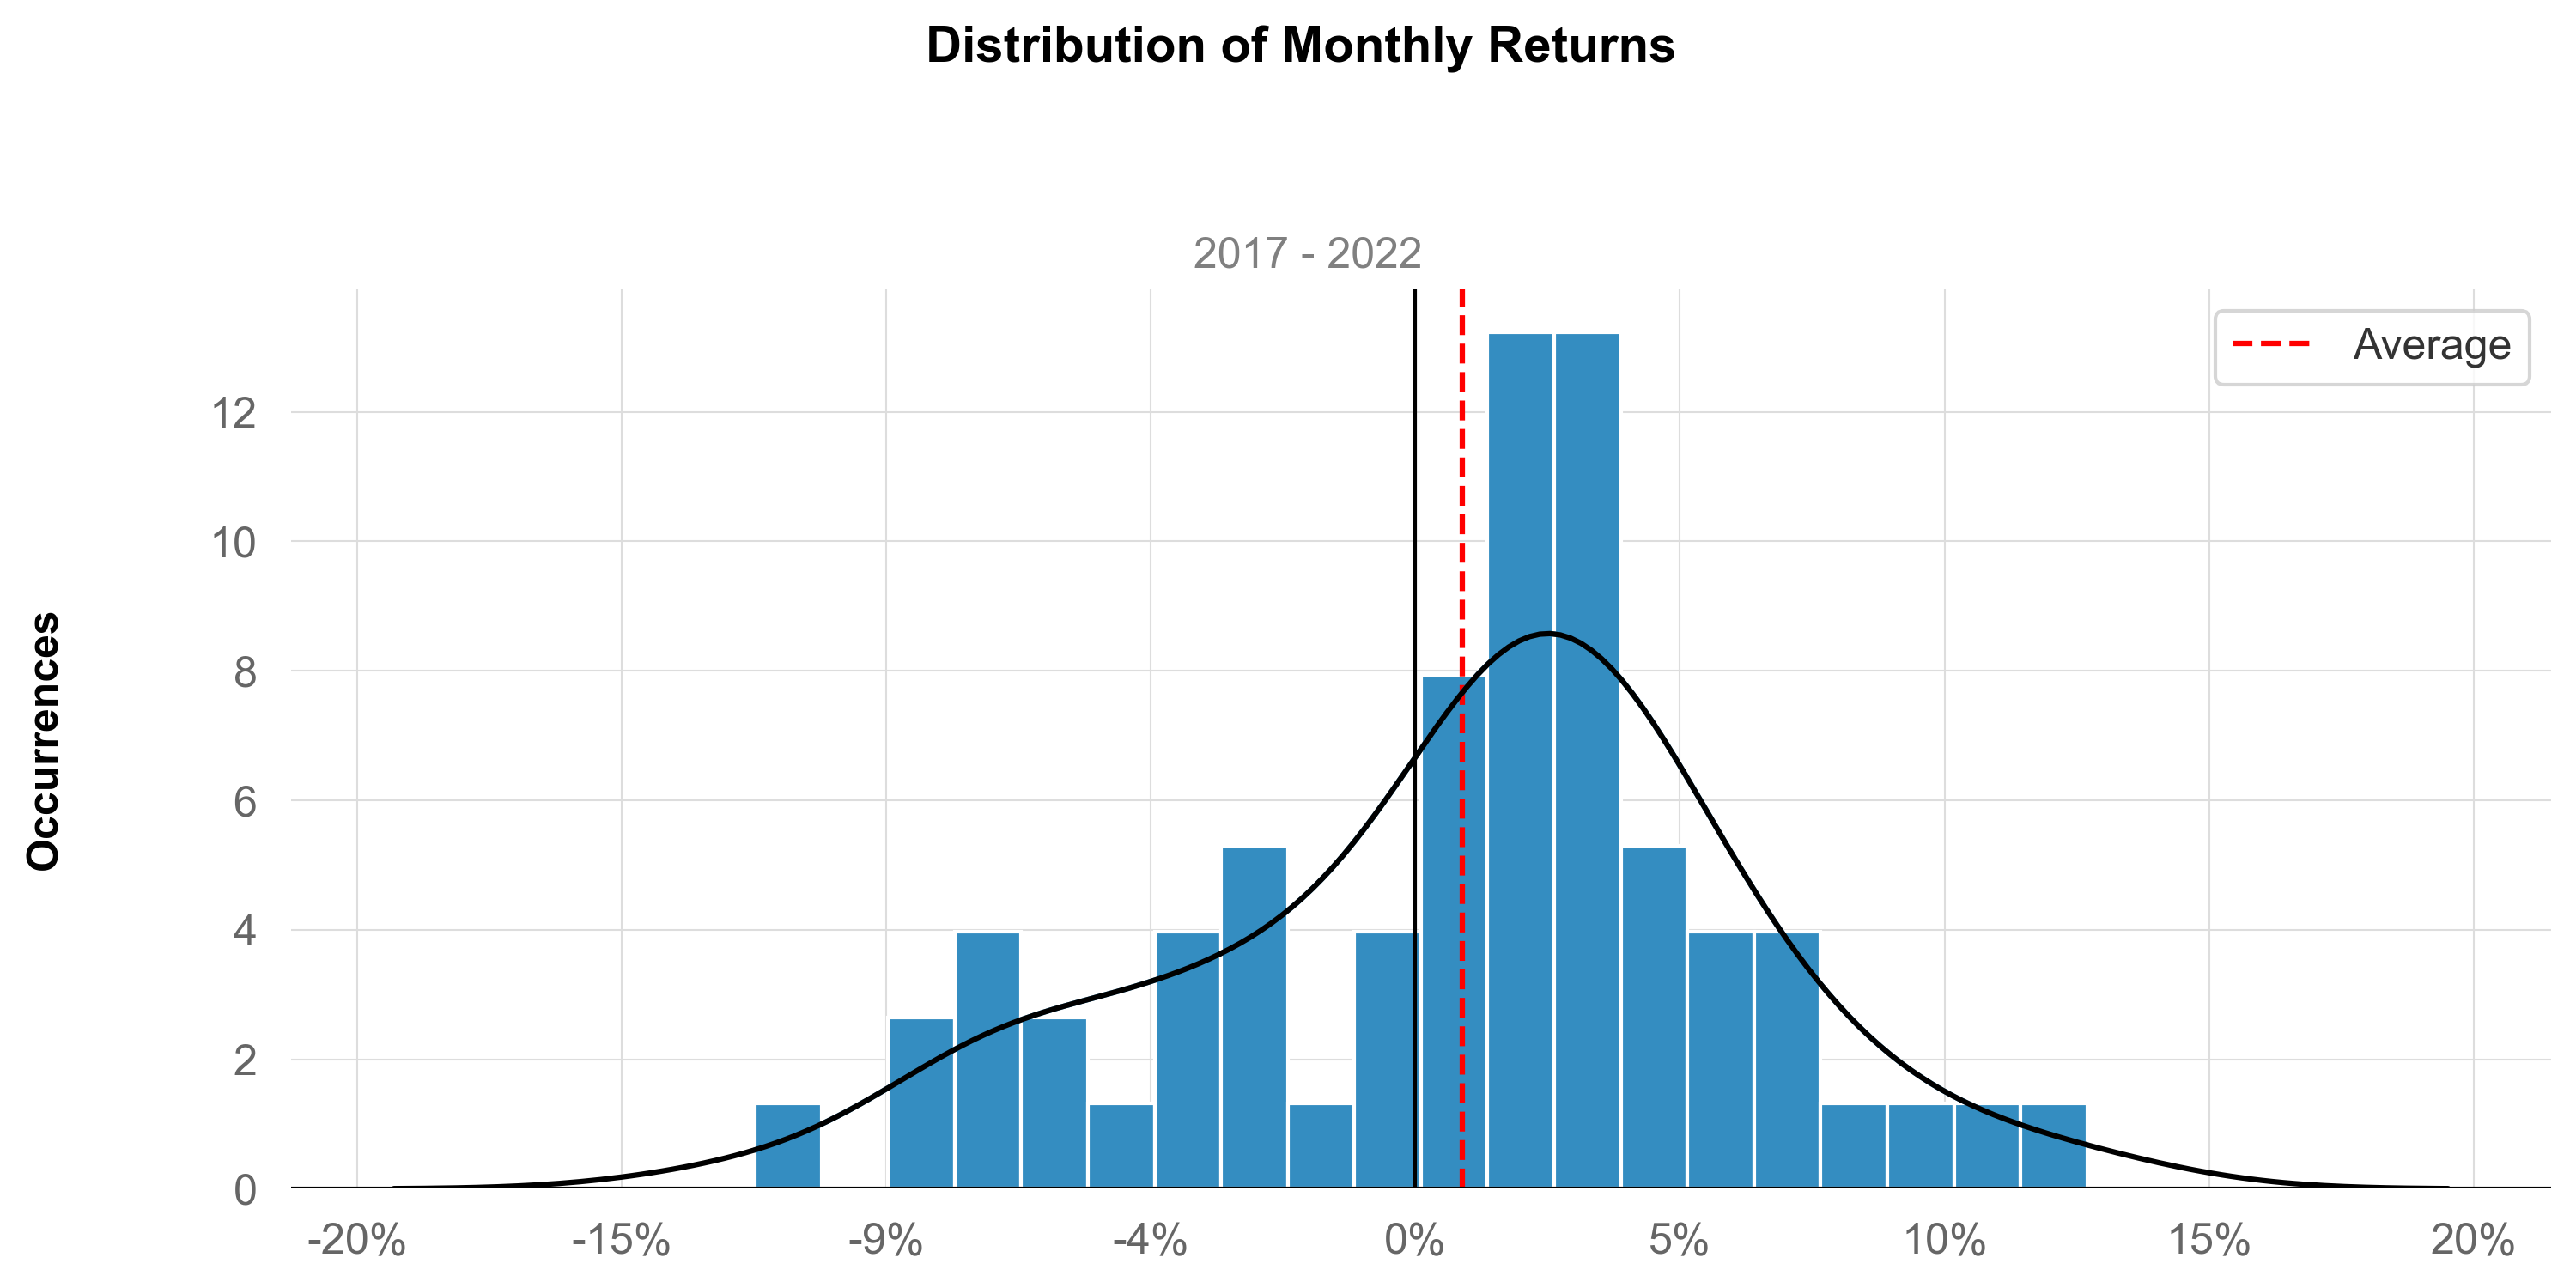
 drawdown (returns, grayscale=False, figsize=(10, 3), fontname='Arial',
           lw=1, log_scale=False, match_volatility=False, compound=False,
           ylabel='Drawdown', resample=None, subtitle=True, savefig=None,
           show=True)
values = _utils.download_returns('SPY', '5y')
drawdown(values)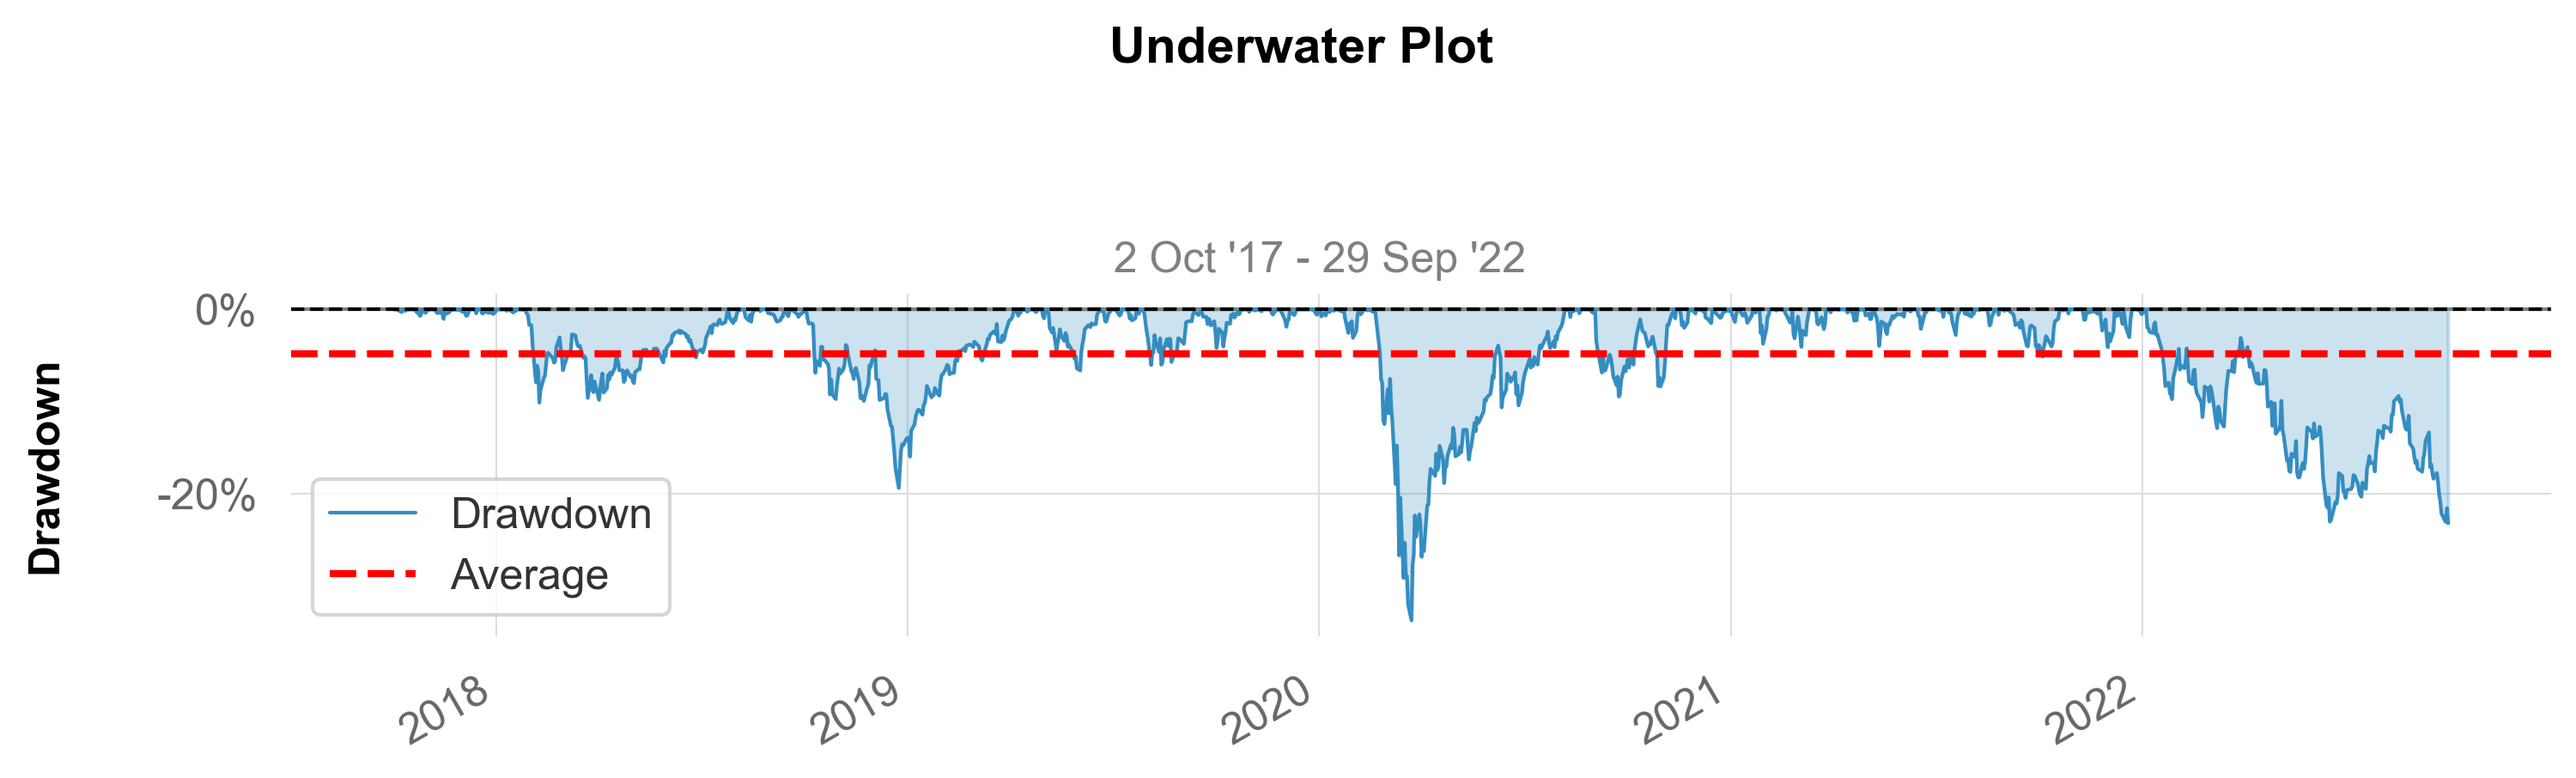
 drawdowns_periods (returns, periods=5, lw=1.5, log_scale=False,
                    fontname='Arial', grayscale=False, figsize=(10, 5),
                    ylabel=True, subtitle=True, compounded=True,
                    savefig=None, show=True, prepare_returns=True)
values = _utils.download_returns('SPY', '5y')
drawdowns_periods(values)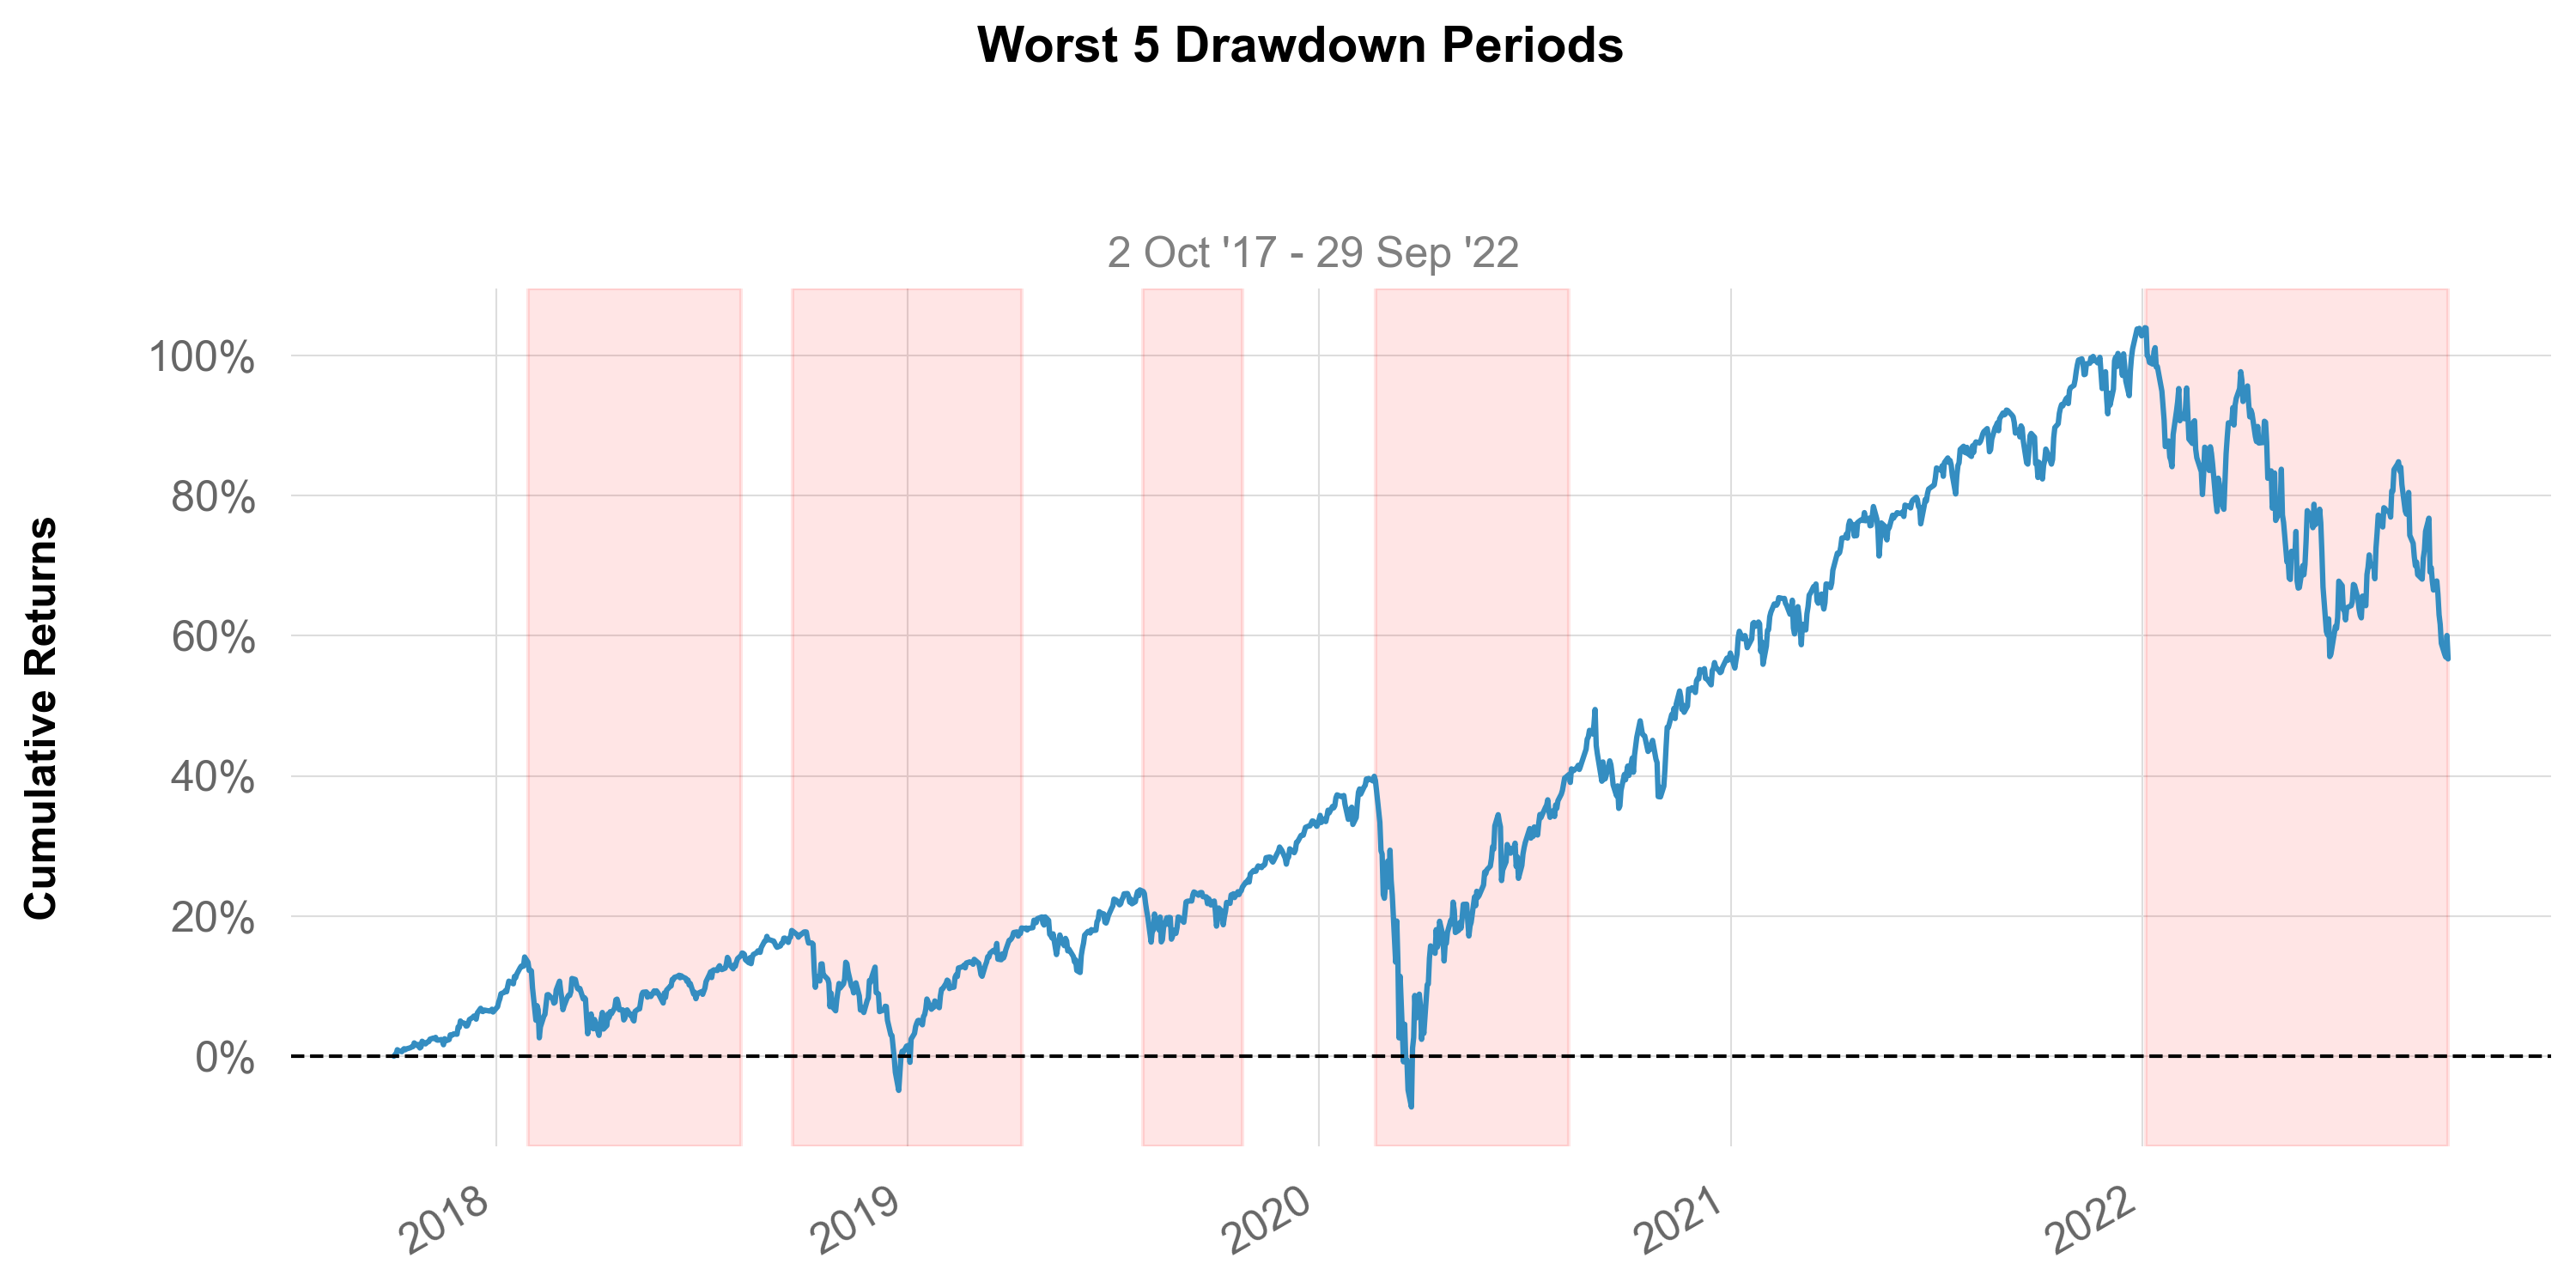
 rolling_beta (returns, benchmark, benchmark_label='Benchmark',
               window1=126, window1_label='6-Months', window2=252,
               window2_label='12-Months', lw=1.5, fontname='Arial',
               grayscale=False, figsize=(10, 3), ylabel=True,
               subtitle=True, savefig=None, show=True,
               prepare_returns=True)
values = _utils.download_returns('SPY', '5y')
benchmark = _utils.download_returns('QQQ', '5y')
rolling_beta(values, benchmark)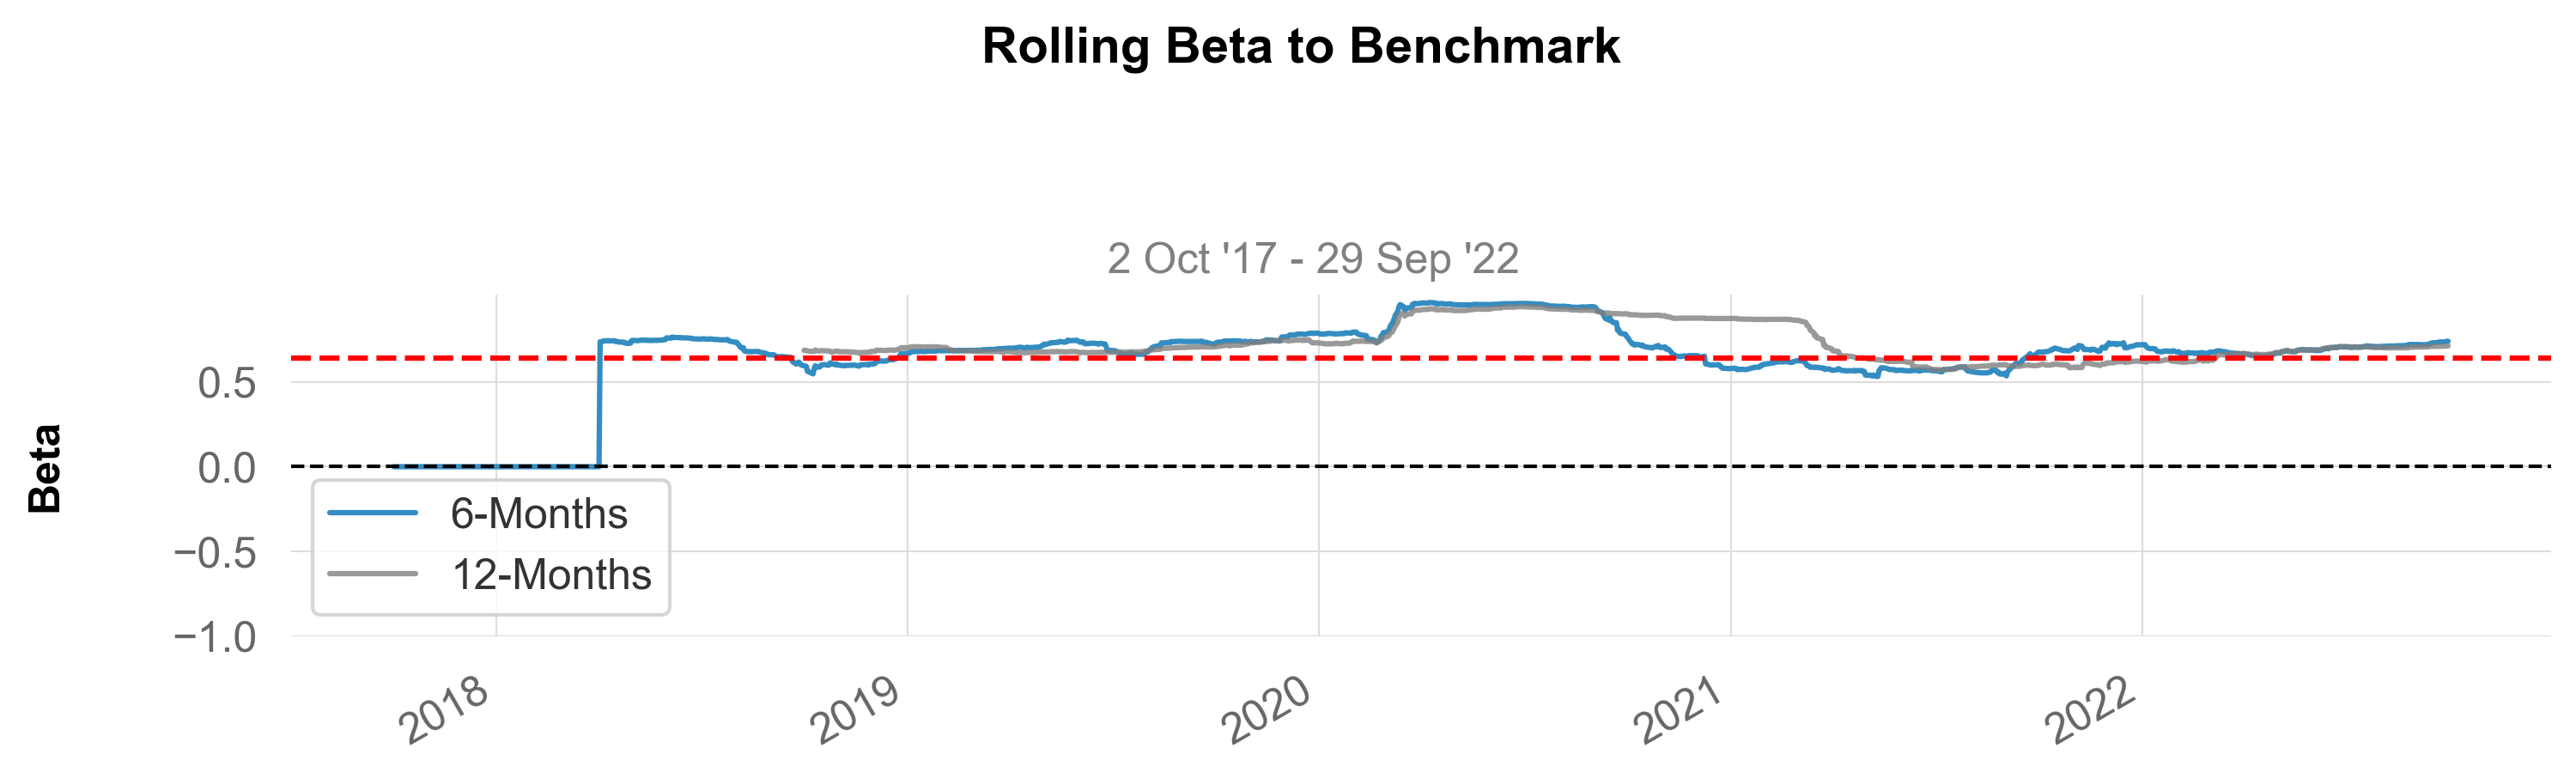
 rolling_volatility (returns, benchmark=None, returns_label='Strategy',
                     benchmark_label='Benchmark', period=126,
                     period_label='6-Months', periods_per_year=252,
                     lw=1.5, fontname='Arial', grayscale=False,
                     figsize=(10, 3), ylabel='Volatility', subtitle=True,
                     savefig=None, show=True)
values = _utils.download_returns('SPY', '5y')
benchmark = _utils.download_returns('QQQ', '5y')
rolling_volatility(values, benchmark)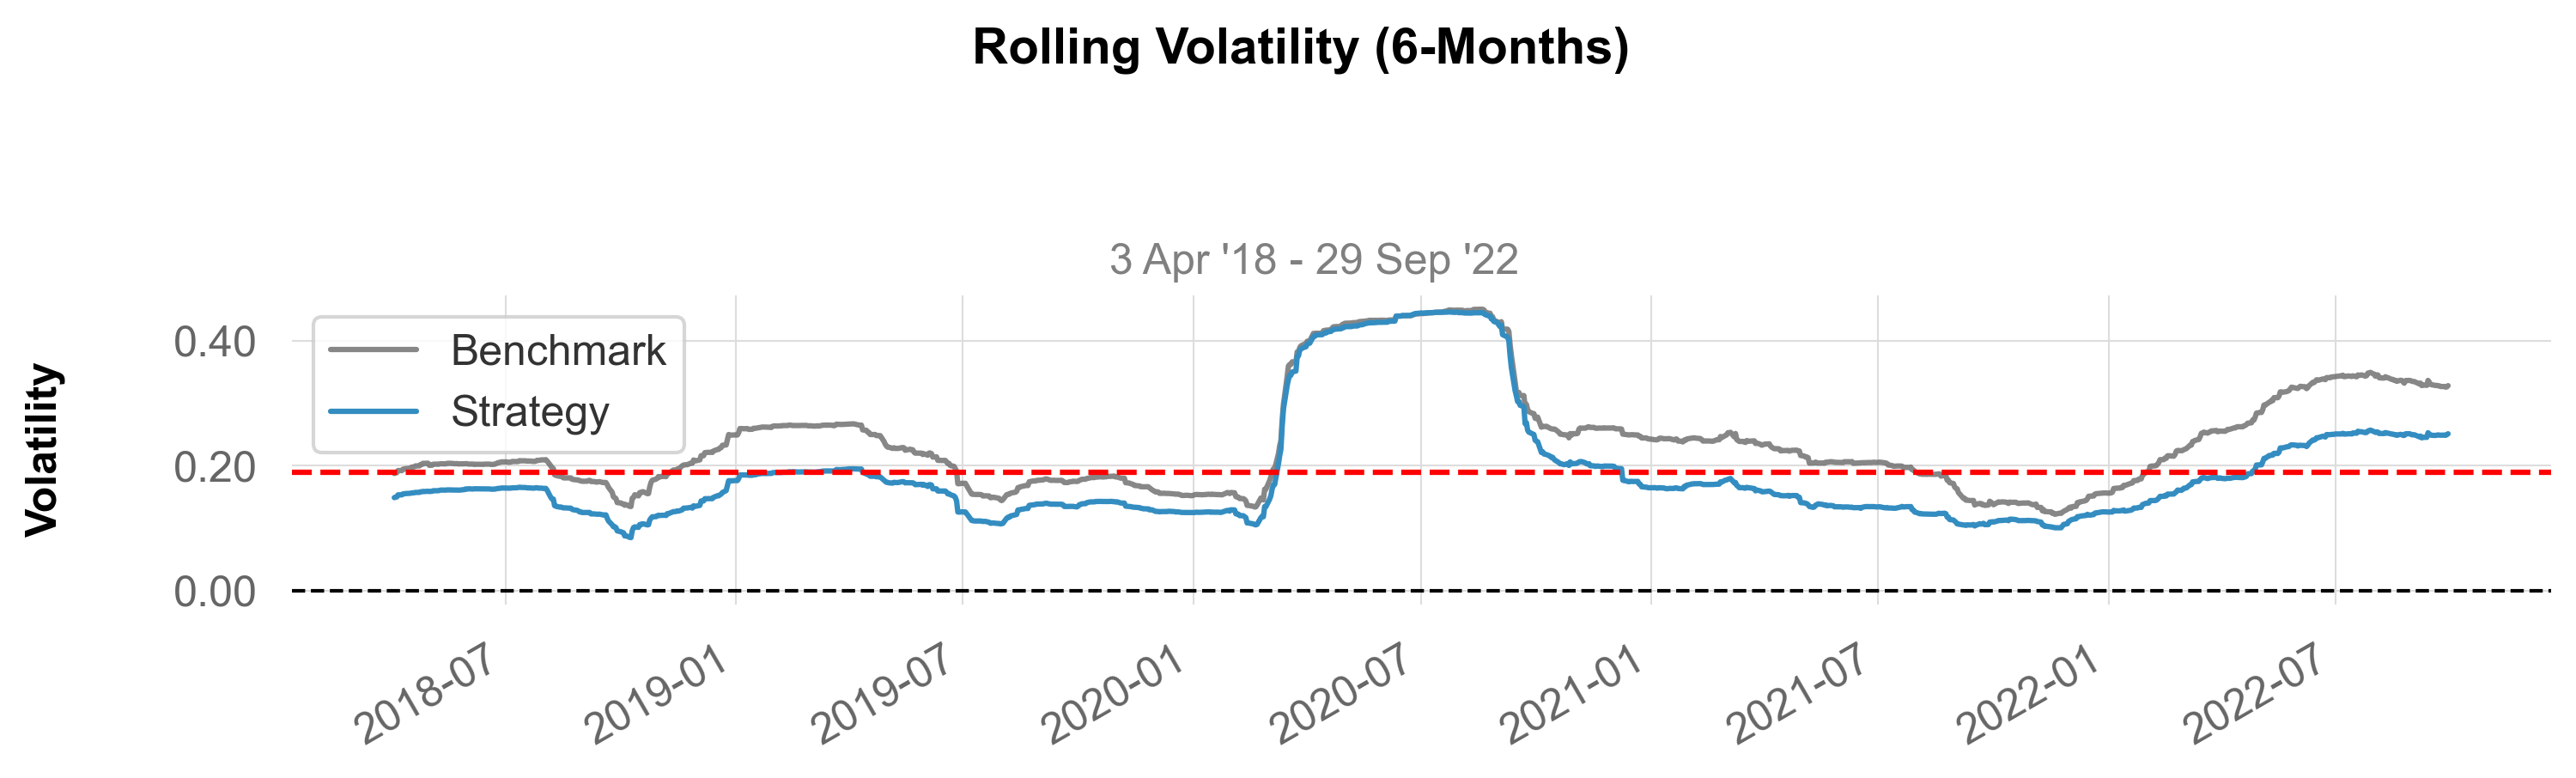
 rolling_sharpe (returns, benchmark=None, rf=0.0,
                 returns_label='Strategy', benchmark_label='Benchmark',
                 period=126, period_label='6-Months',
                 periods_per_year=252, lw=1.25, fontname='Arial',
                 grayscale=False, figsize=(10, 3), ylabel='Sharpe',
                 subtitle=True, savefig=None, show=True)
values = _utils.download_returns('SPY', '5y')
benchmark = _utils.download_returns('QQQ', '5y')
rolling_sharpe(values, benchmark)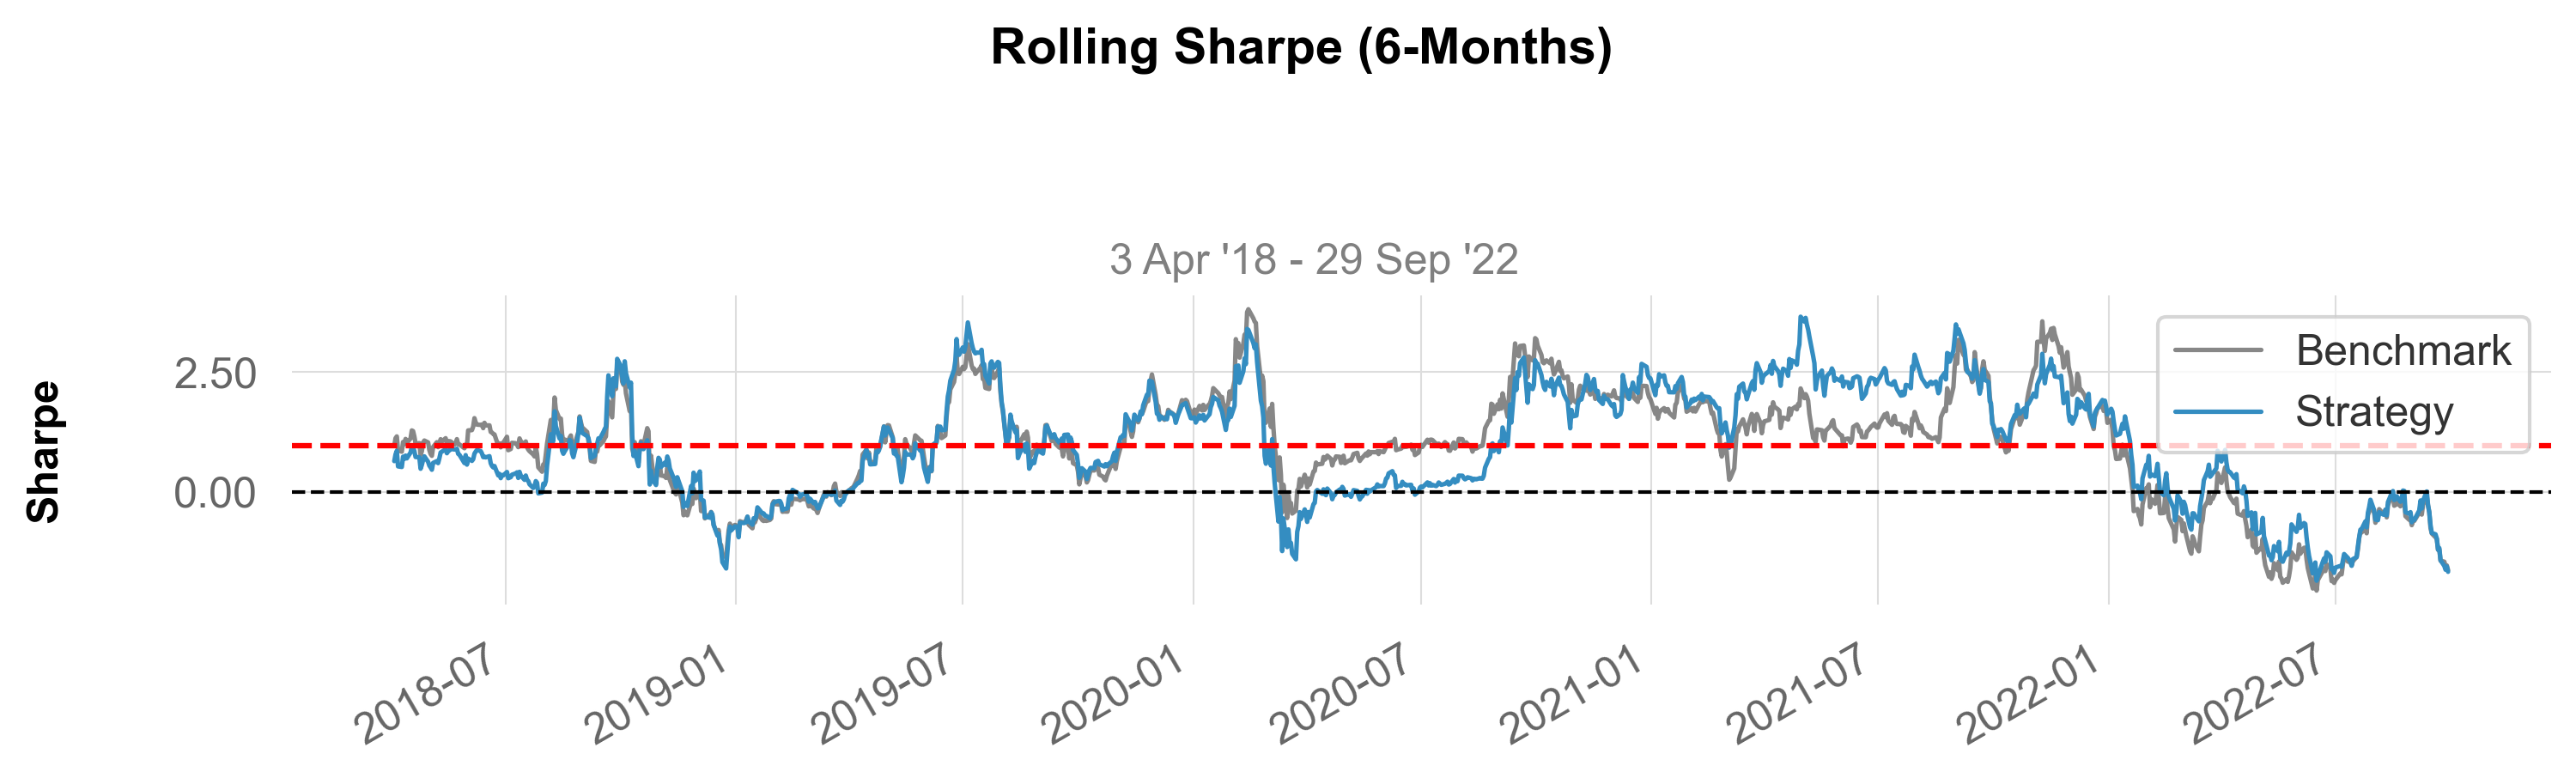
 rolling_sortino (returns, benchmark=None, rf=0.0,
                  returns_label='Strategy', benchmark_label='Benchmark',
                  period=126, period_label='6-Months',
                  periods_per_year=252, lw=1.25, fontname='Arial',
                  grayscale=False, figsize=(10, 3), ylabel='Sortino',
                  subtitle=True, savefig=None, show=True)
values = _utils.download_returns('SPY', '5y')
benchmark = _utils.download_returns('QQQ', '5y')
rolling_sortino(values, benchmark)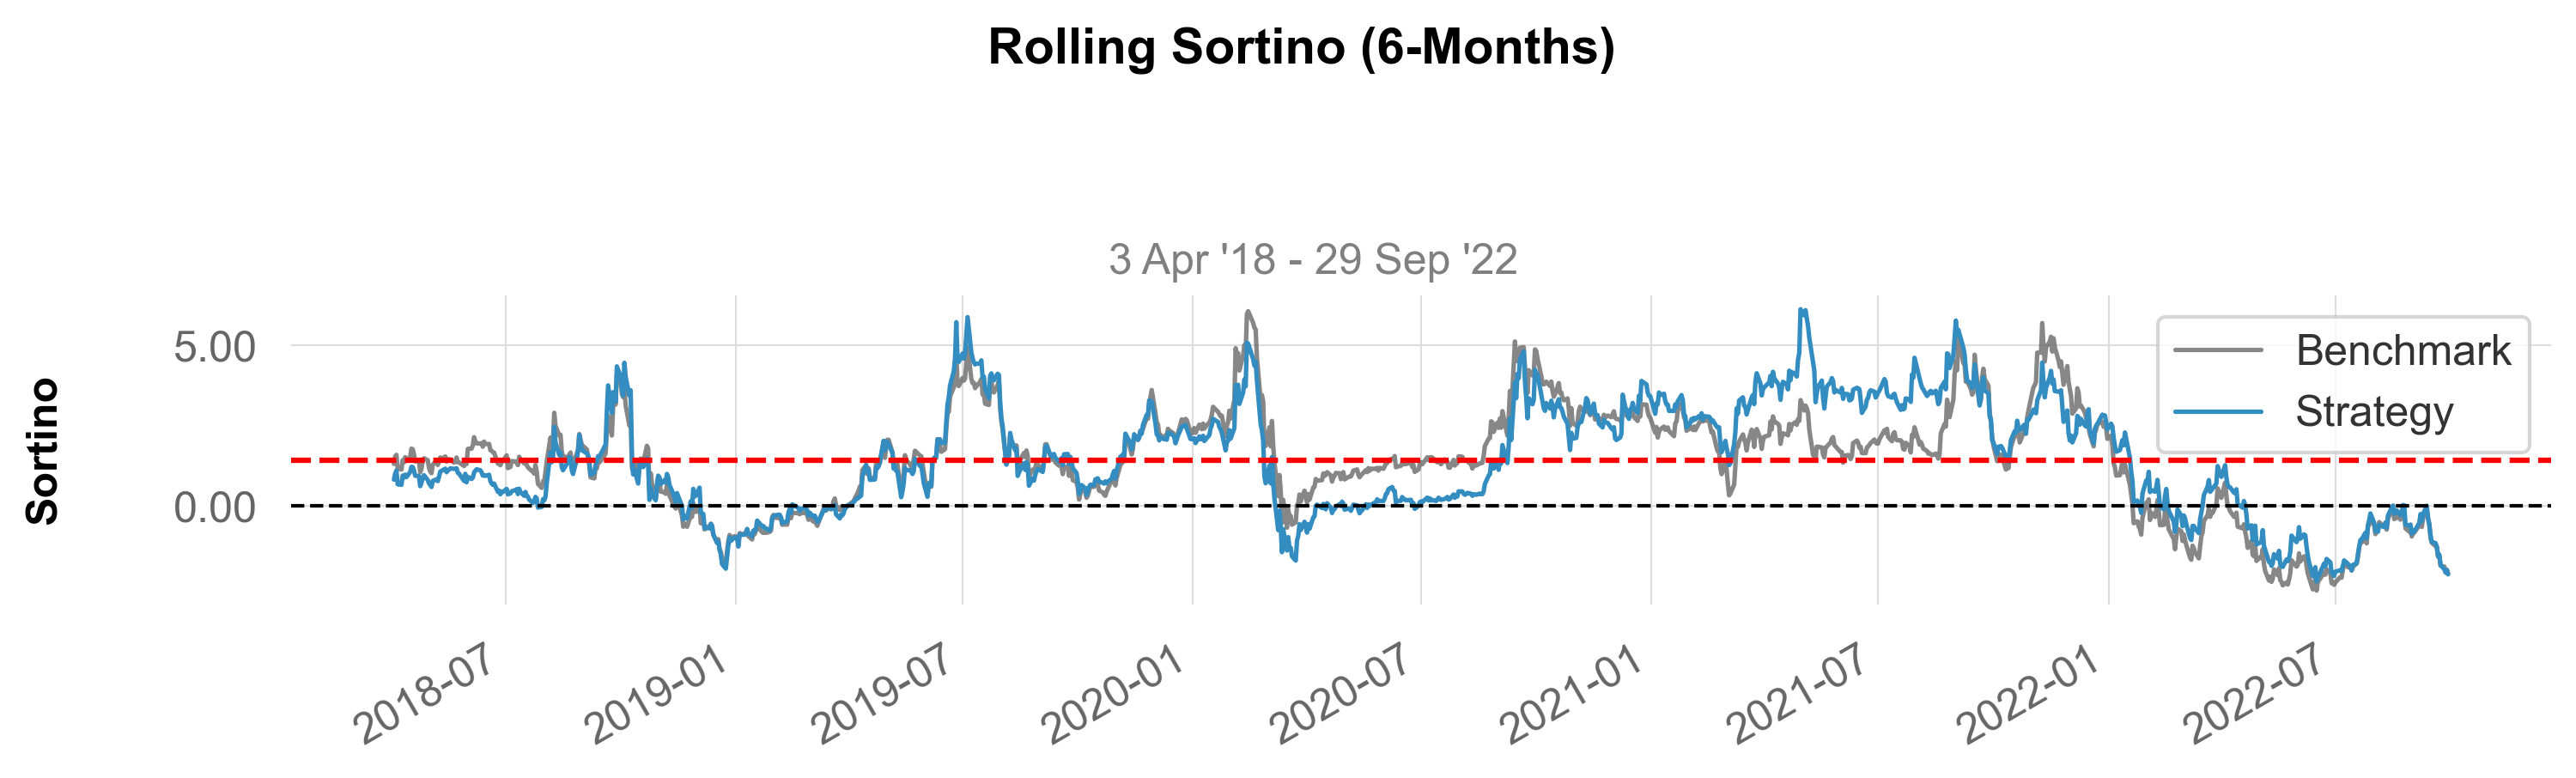
 monthly_heatmap (returns, annot_size=10, figsize=(10, 5), cbar=True,
                  square=False, compounded=True, eoy=False,
                  grayscale=False, fontname='Arial', ylabel=True,
                  savefig=None, show=True)
values = _utils.download_returns('SPY', '5y')
monthly_heatmap(values, eoy=True)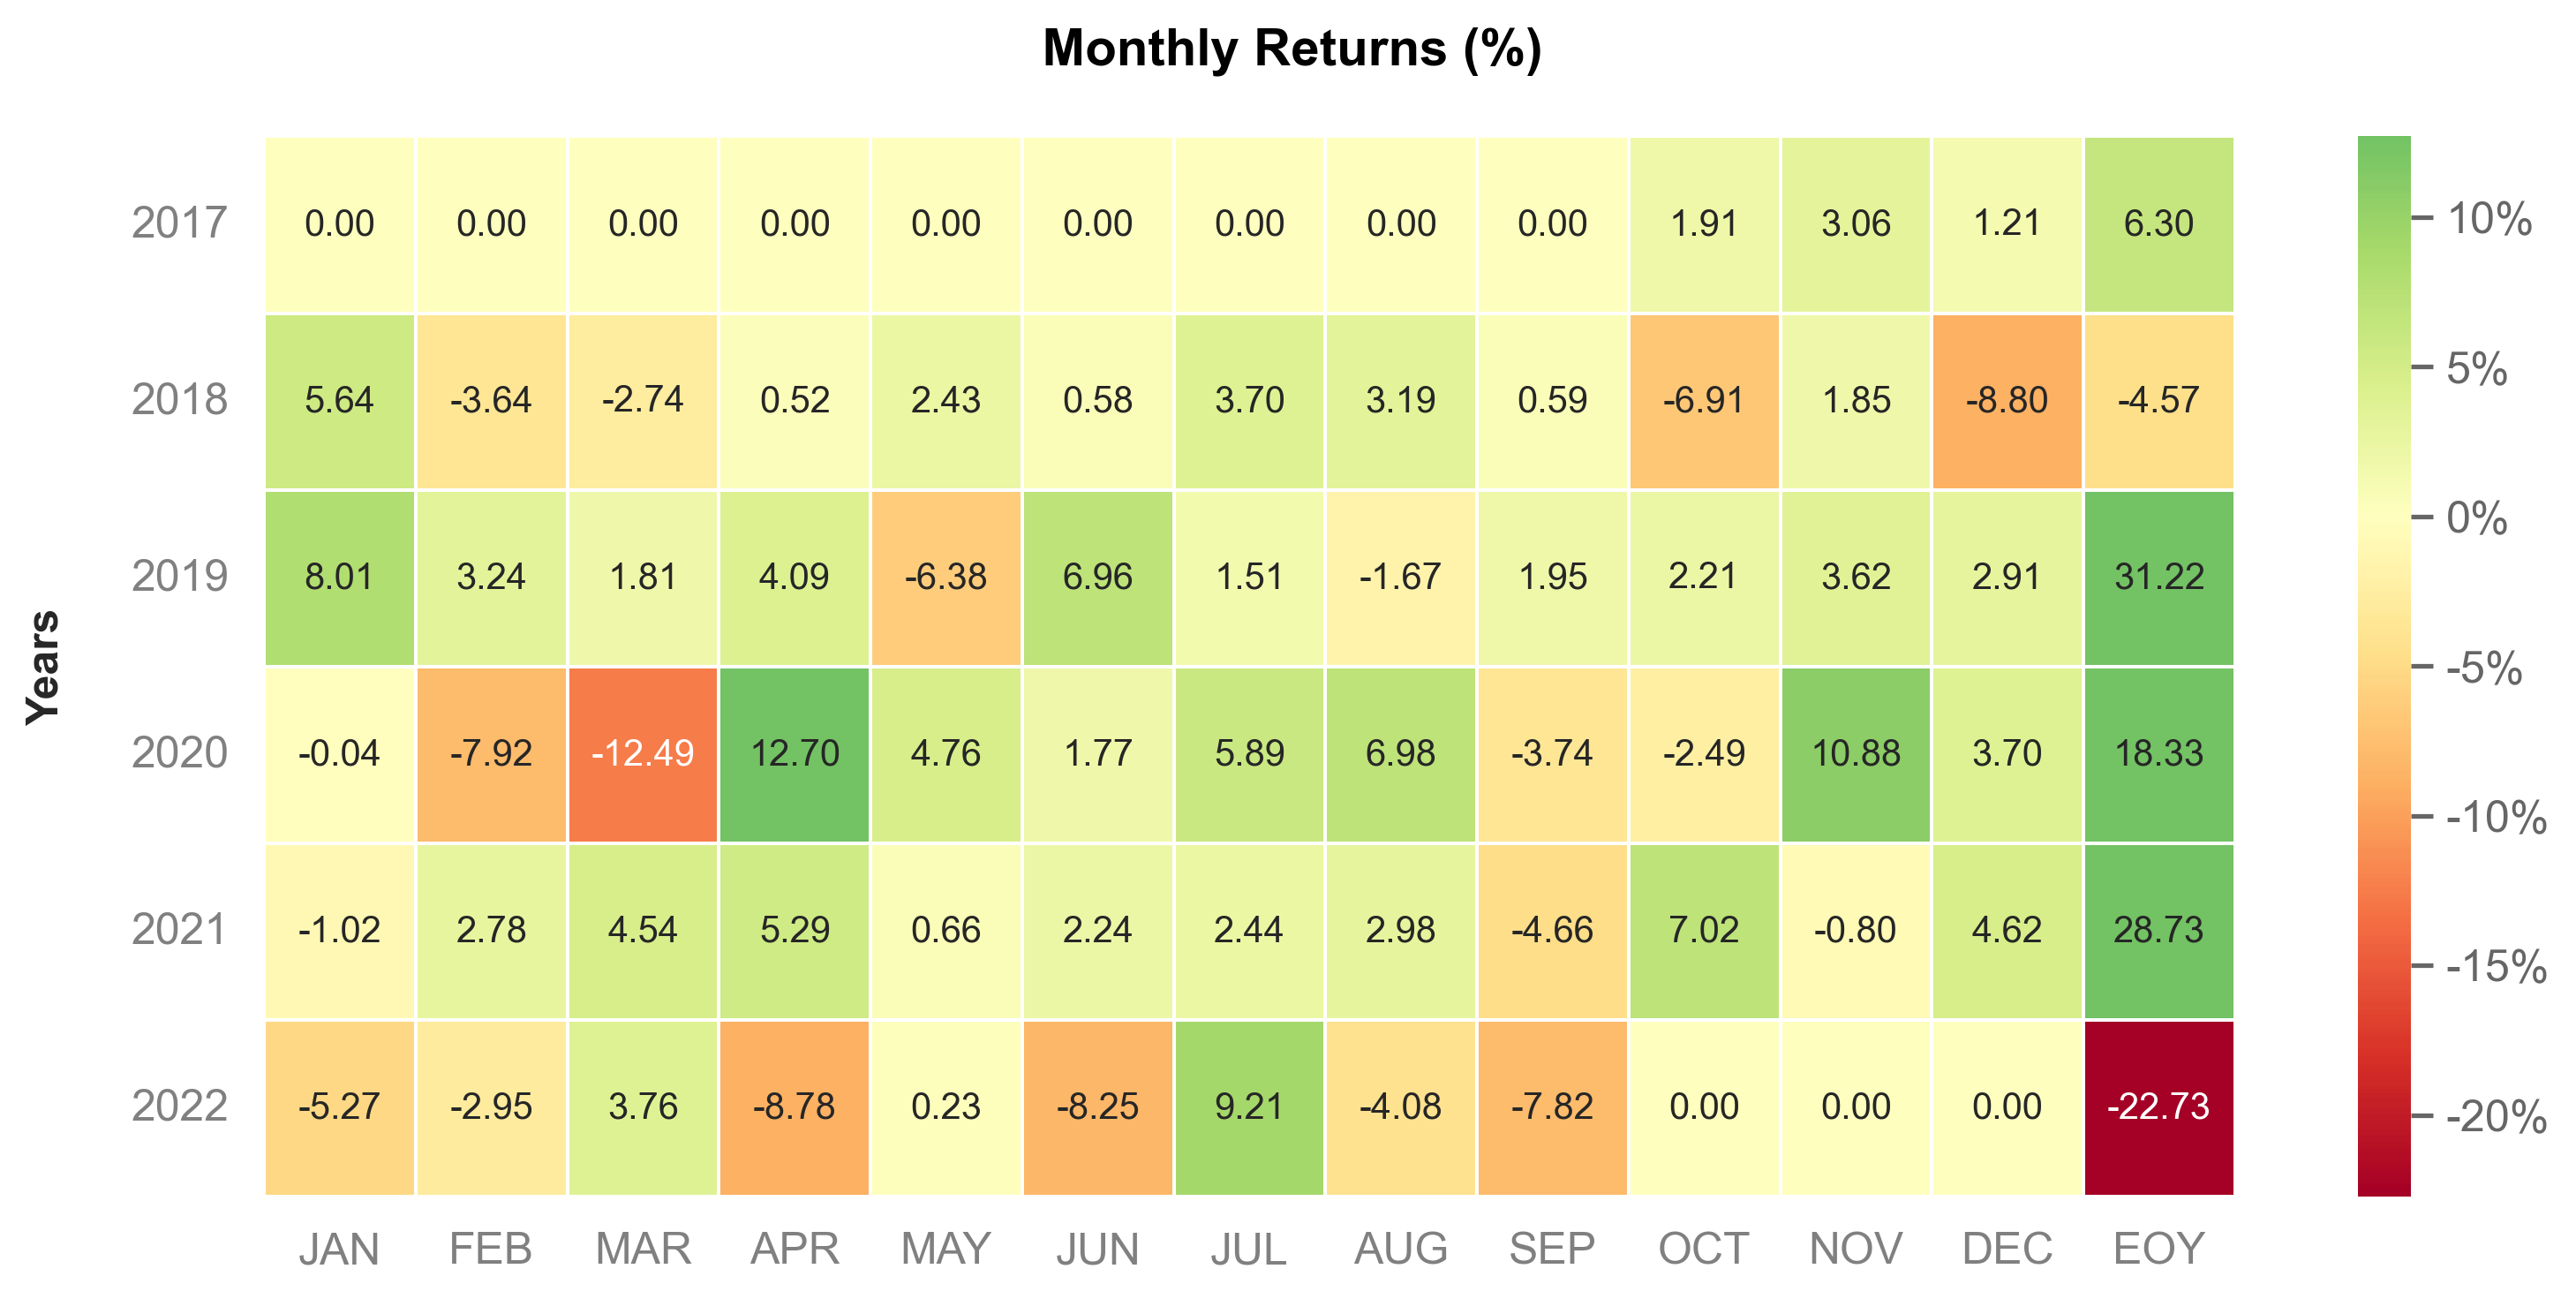
 outperformance_heatmap (returns, benchmark=None, annot_size=10,
                         figsize=(10, 5), cbar=True, square=False,
                         benchmark_label='Benchmark', compounded=True,
                         eoy=False, grayscale=False, fontname='Arial',
                         ylabel=True, savefig=None, show=True)
values = _utils.download_returns('SPY', '5y')
benchmark = _utils.download_returns('QQQ', '5y')
outperformance_heatmap(values, benchmark)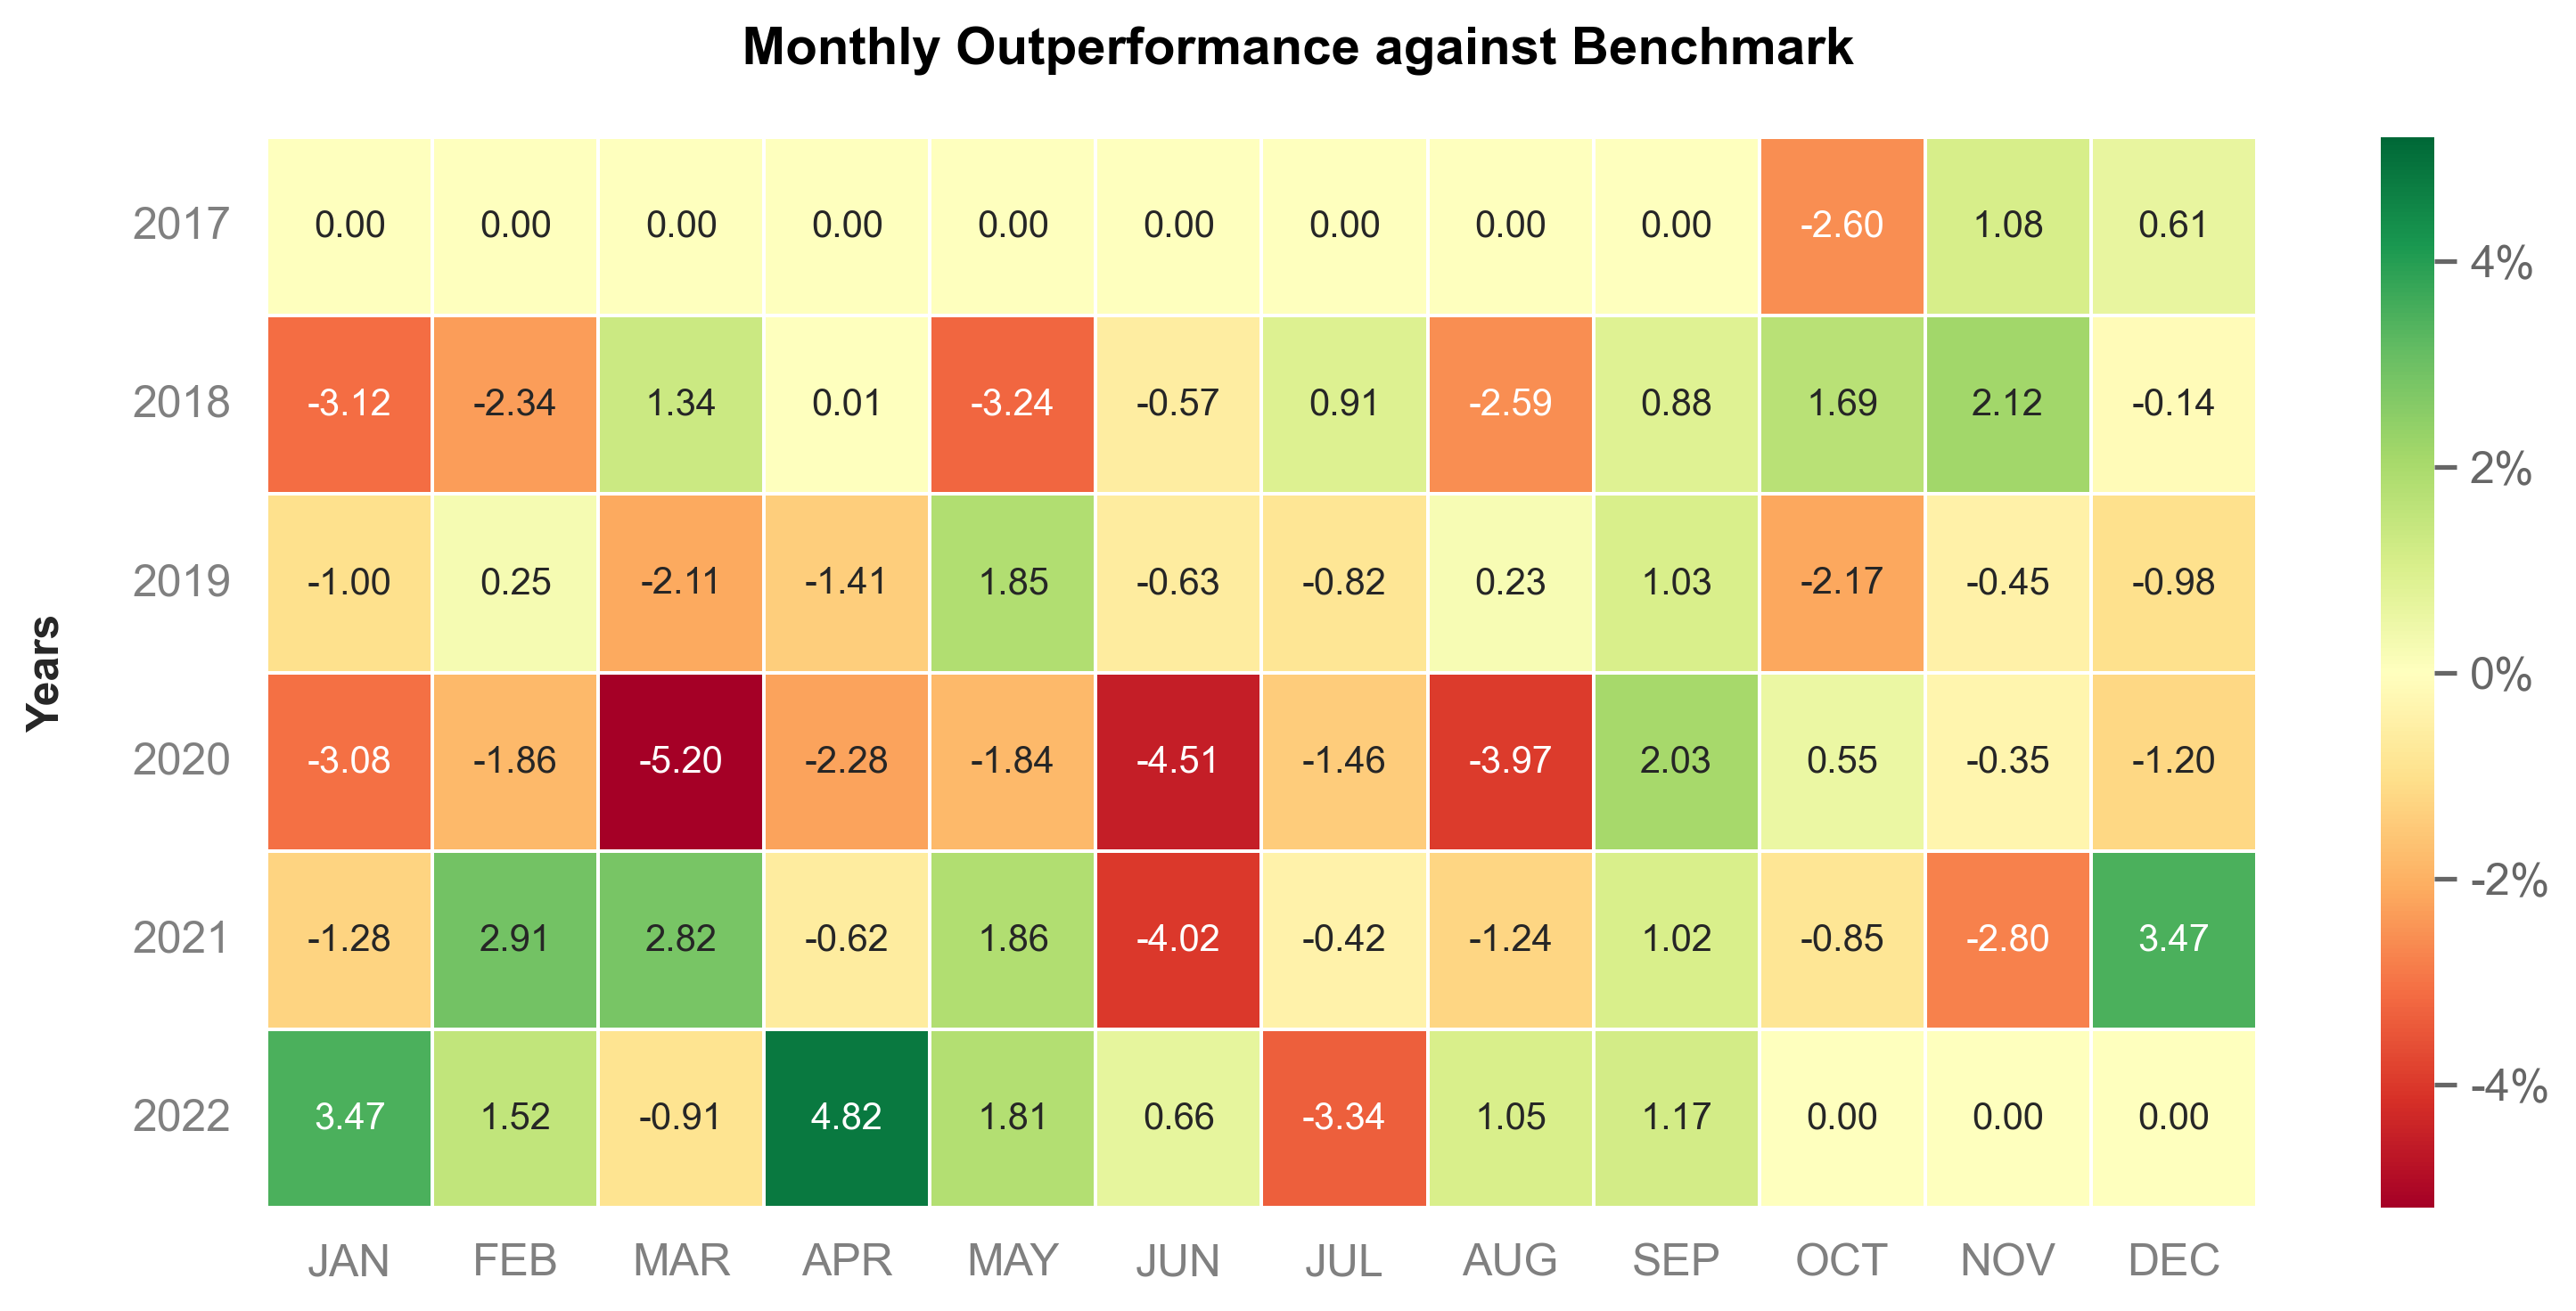
 monthly_returns (returns, annot_size=10, figsize=(10, 5), cbar=True,
                  square=False, compounded=True, eoy=False,
                  grayscale=False, fontname='Arial', ylabel=True,
                  savefig=None, show=True)
A wrapper for monthly heatmaps