source
metrics
 metrics (returns, benchmark=None, rf=0.0, display=True, mode='basic',
          sep=False, compounded=True, periods_per_year=252,
          prepare_returns=True, match_dates=False, **kwargs)
returns = _utils.download_returns('SPY', '5y')
benchmark = _utils.download_returns('QQQ', '5y')
# √ may be encodable
metrics(returns, benchmark, returns_title = 'SPY', benchmark_title = 'QQQ')
SPY QQQ
------------------ ---------- ----------
Start Period 2017-10-02 2017-10-02
End Period 2022-09-30 2022-09-30
Risk-Free Rate 0.0% 0.0%
Time in Market 100.0% 100.0%
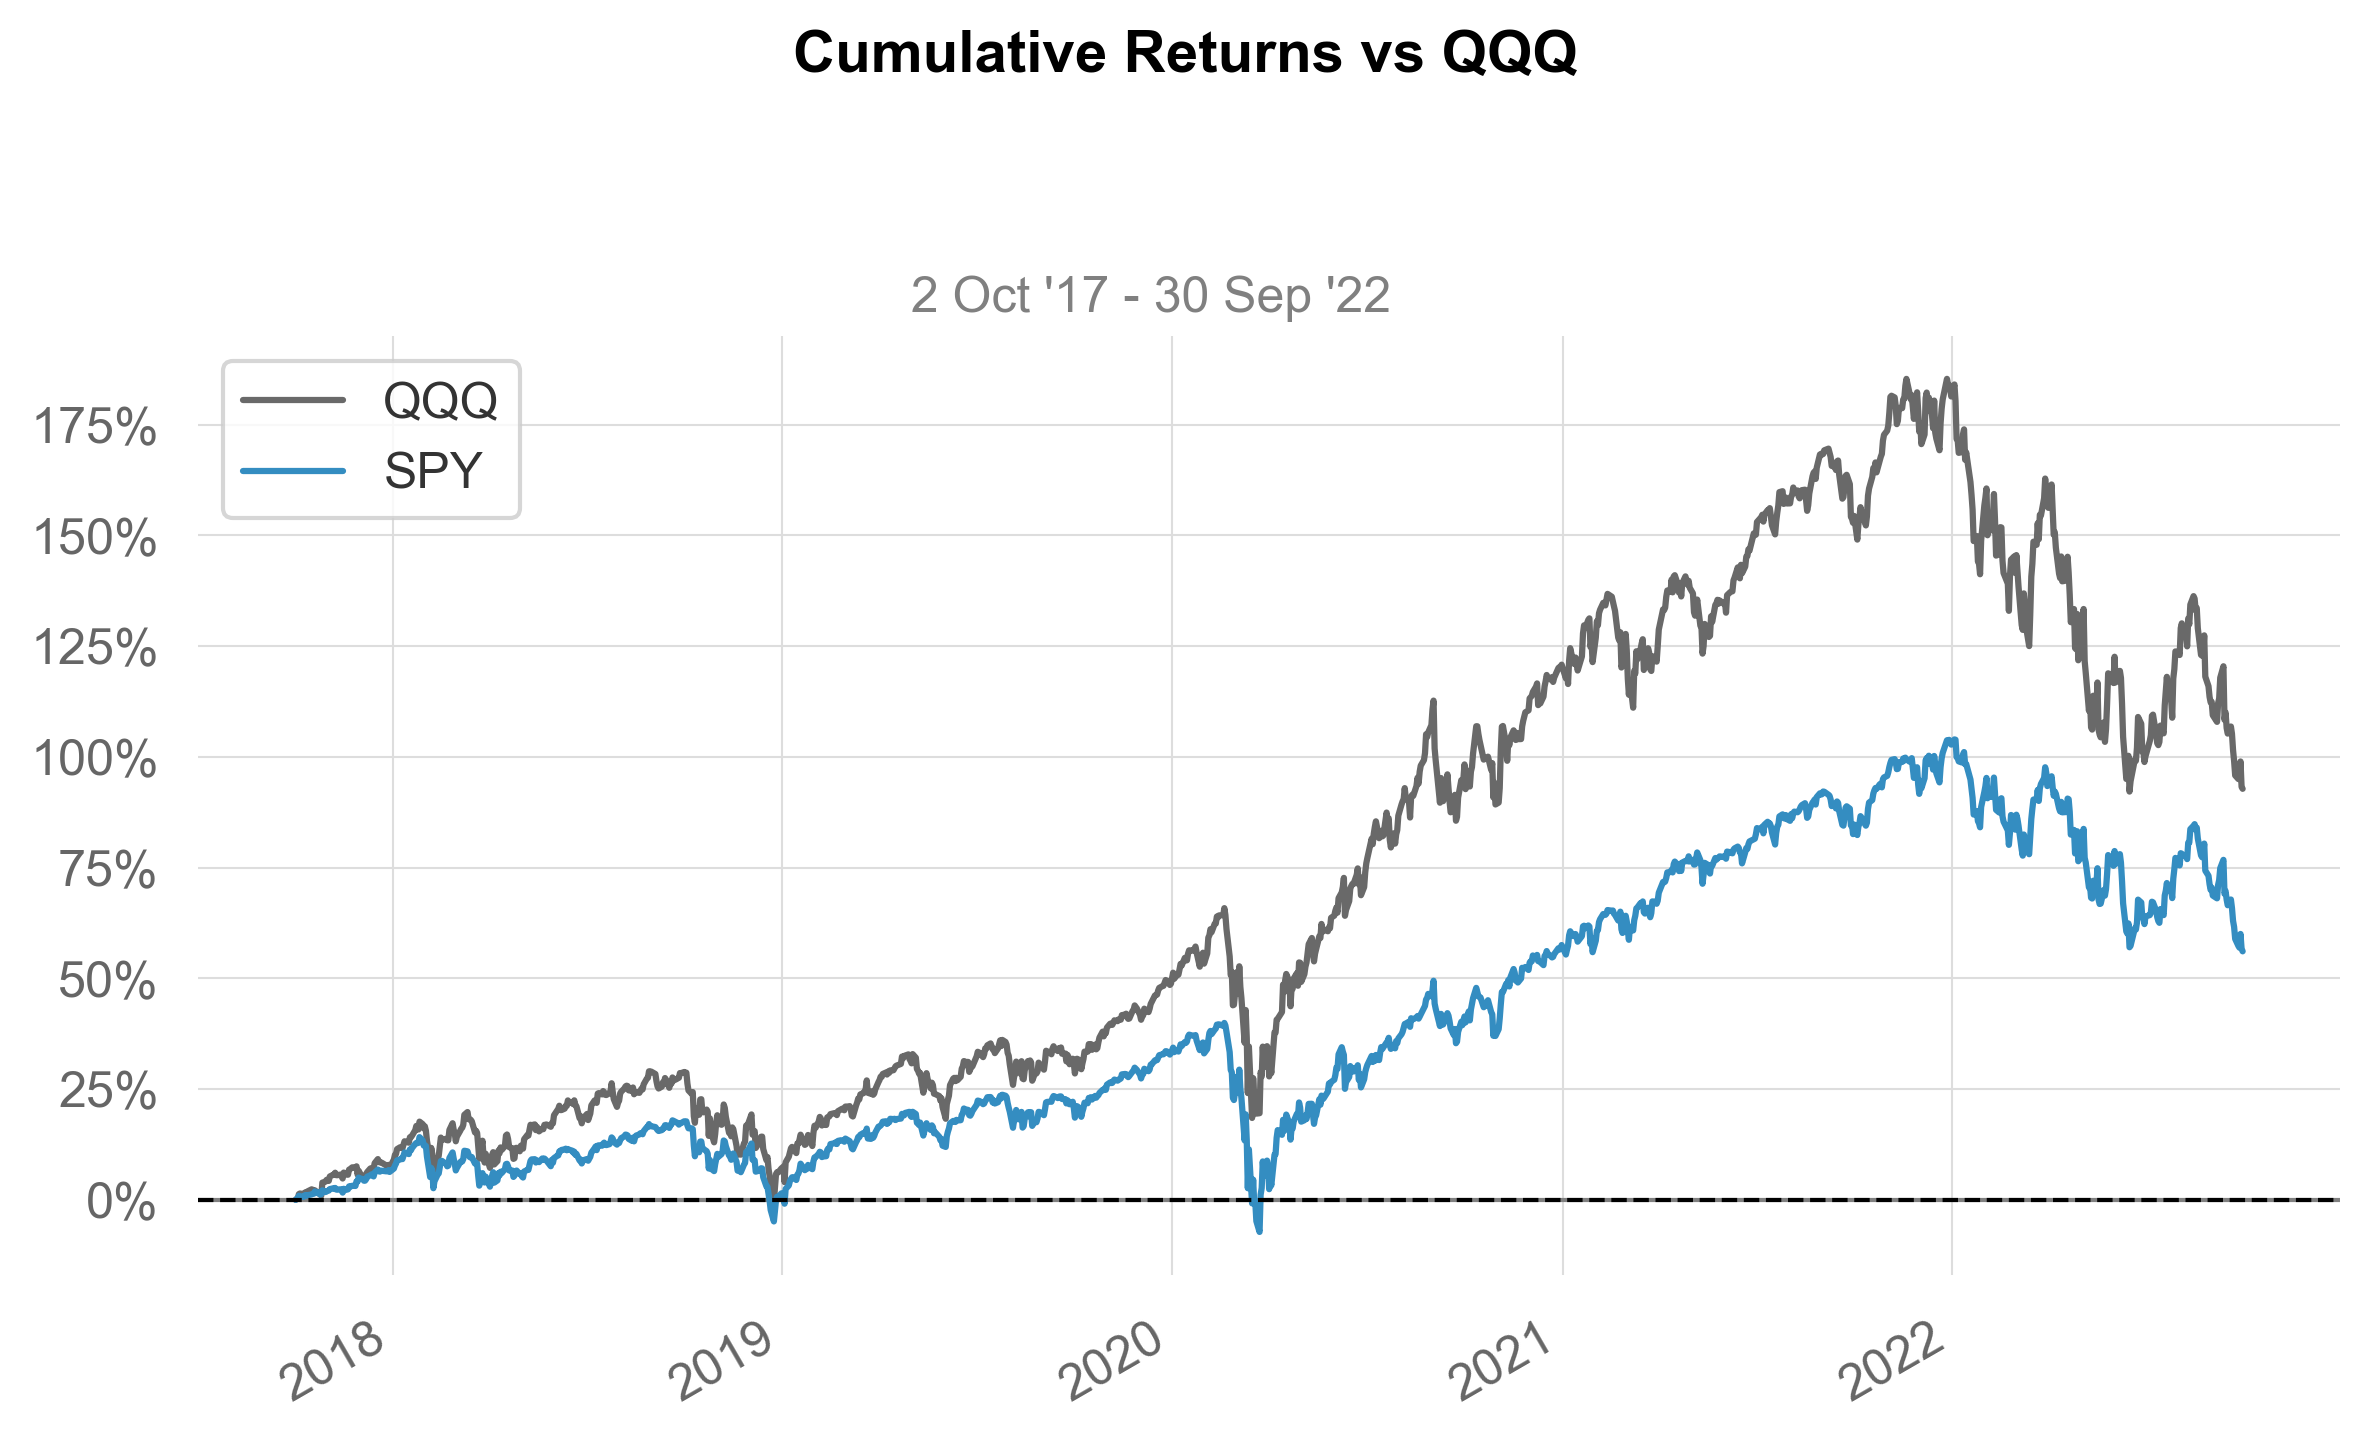
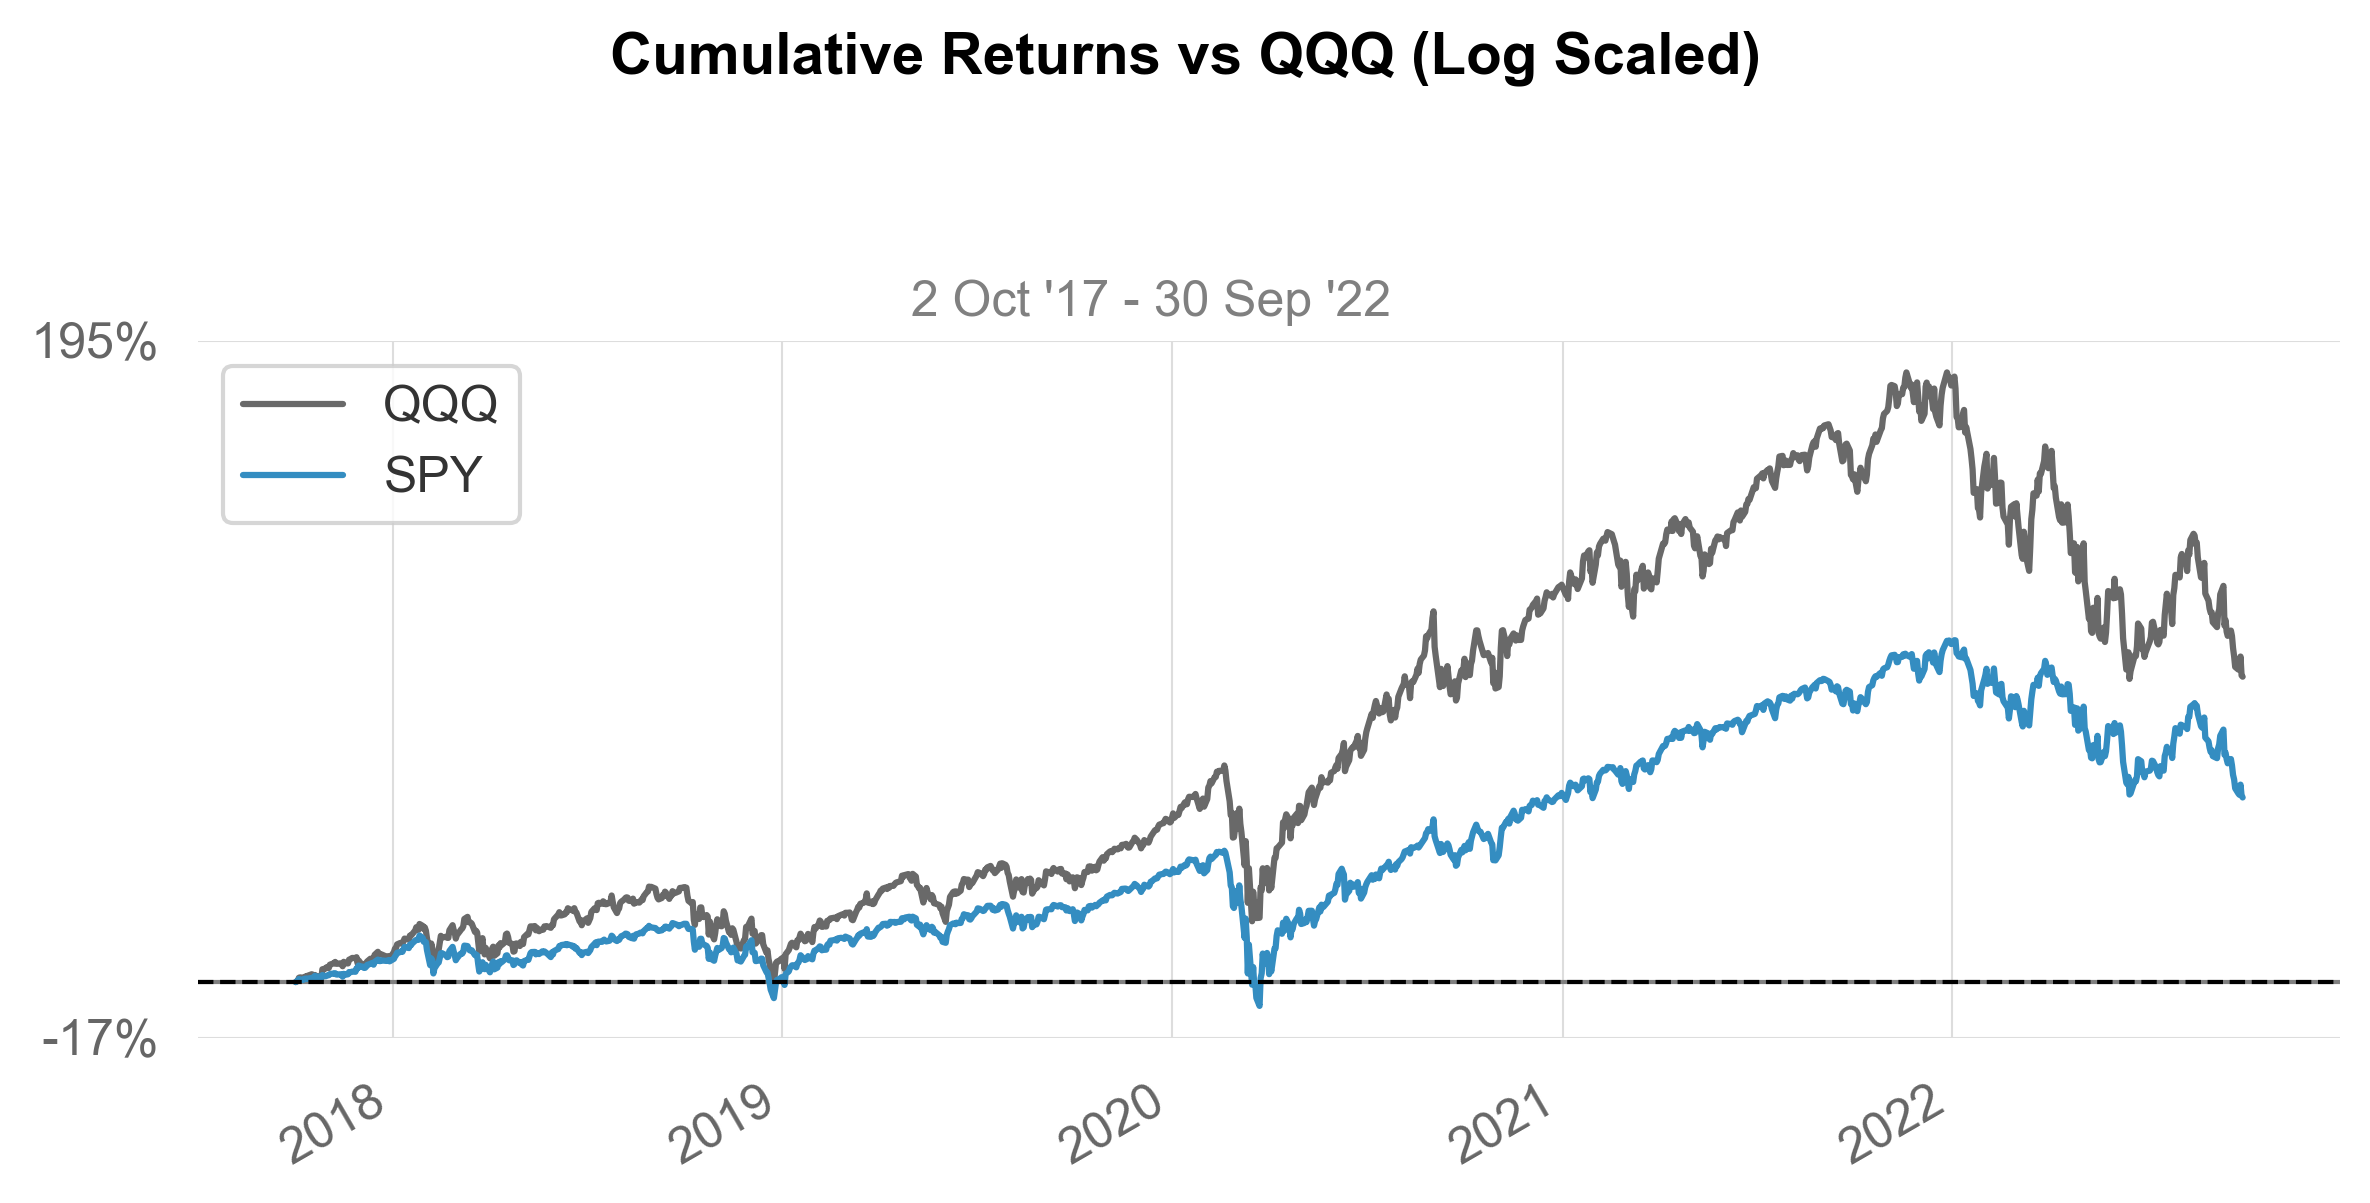
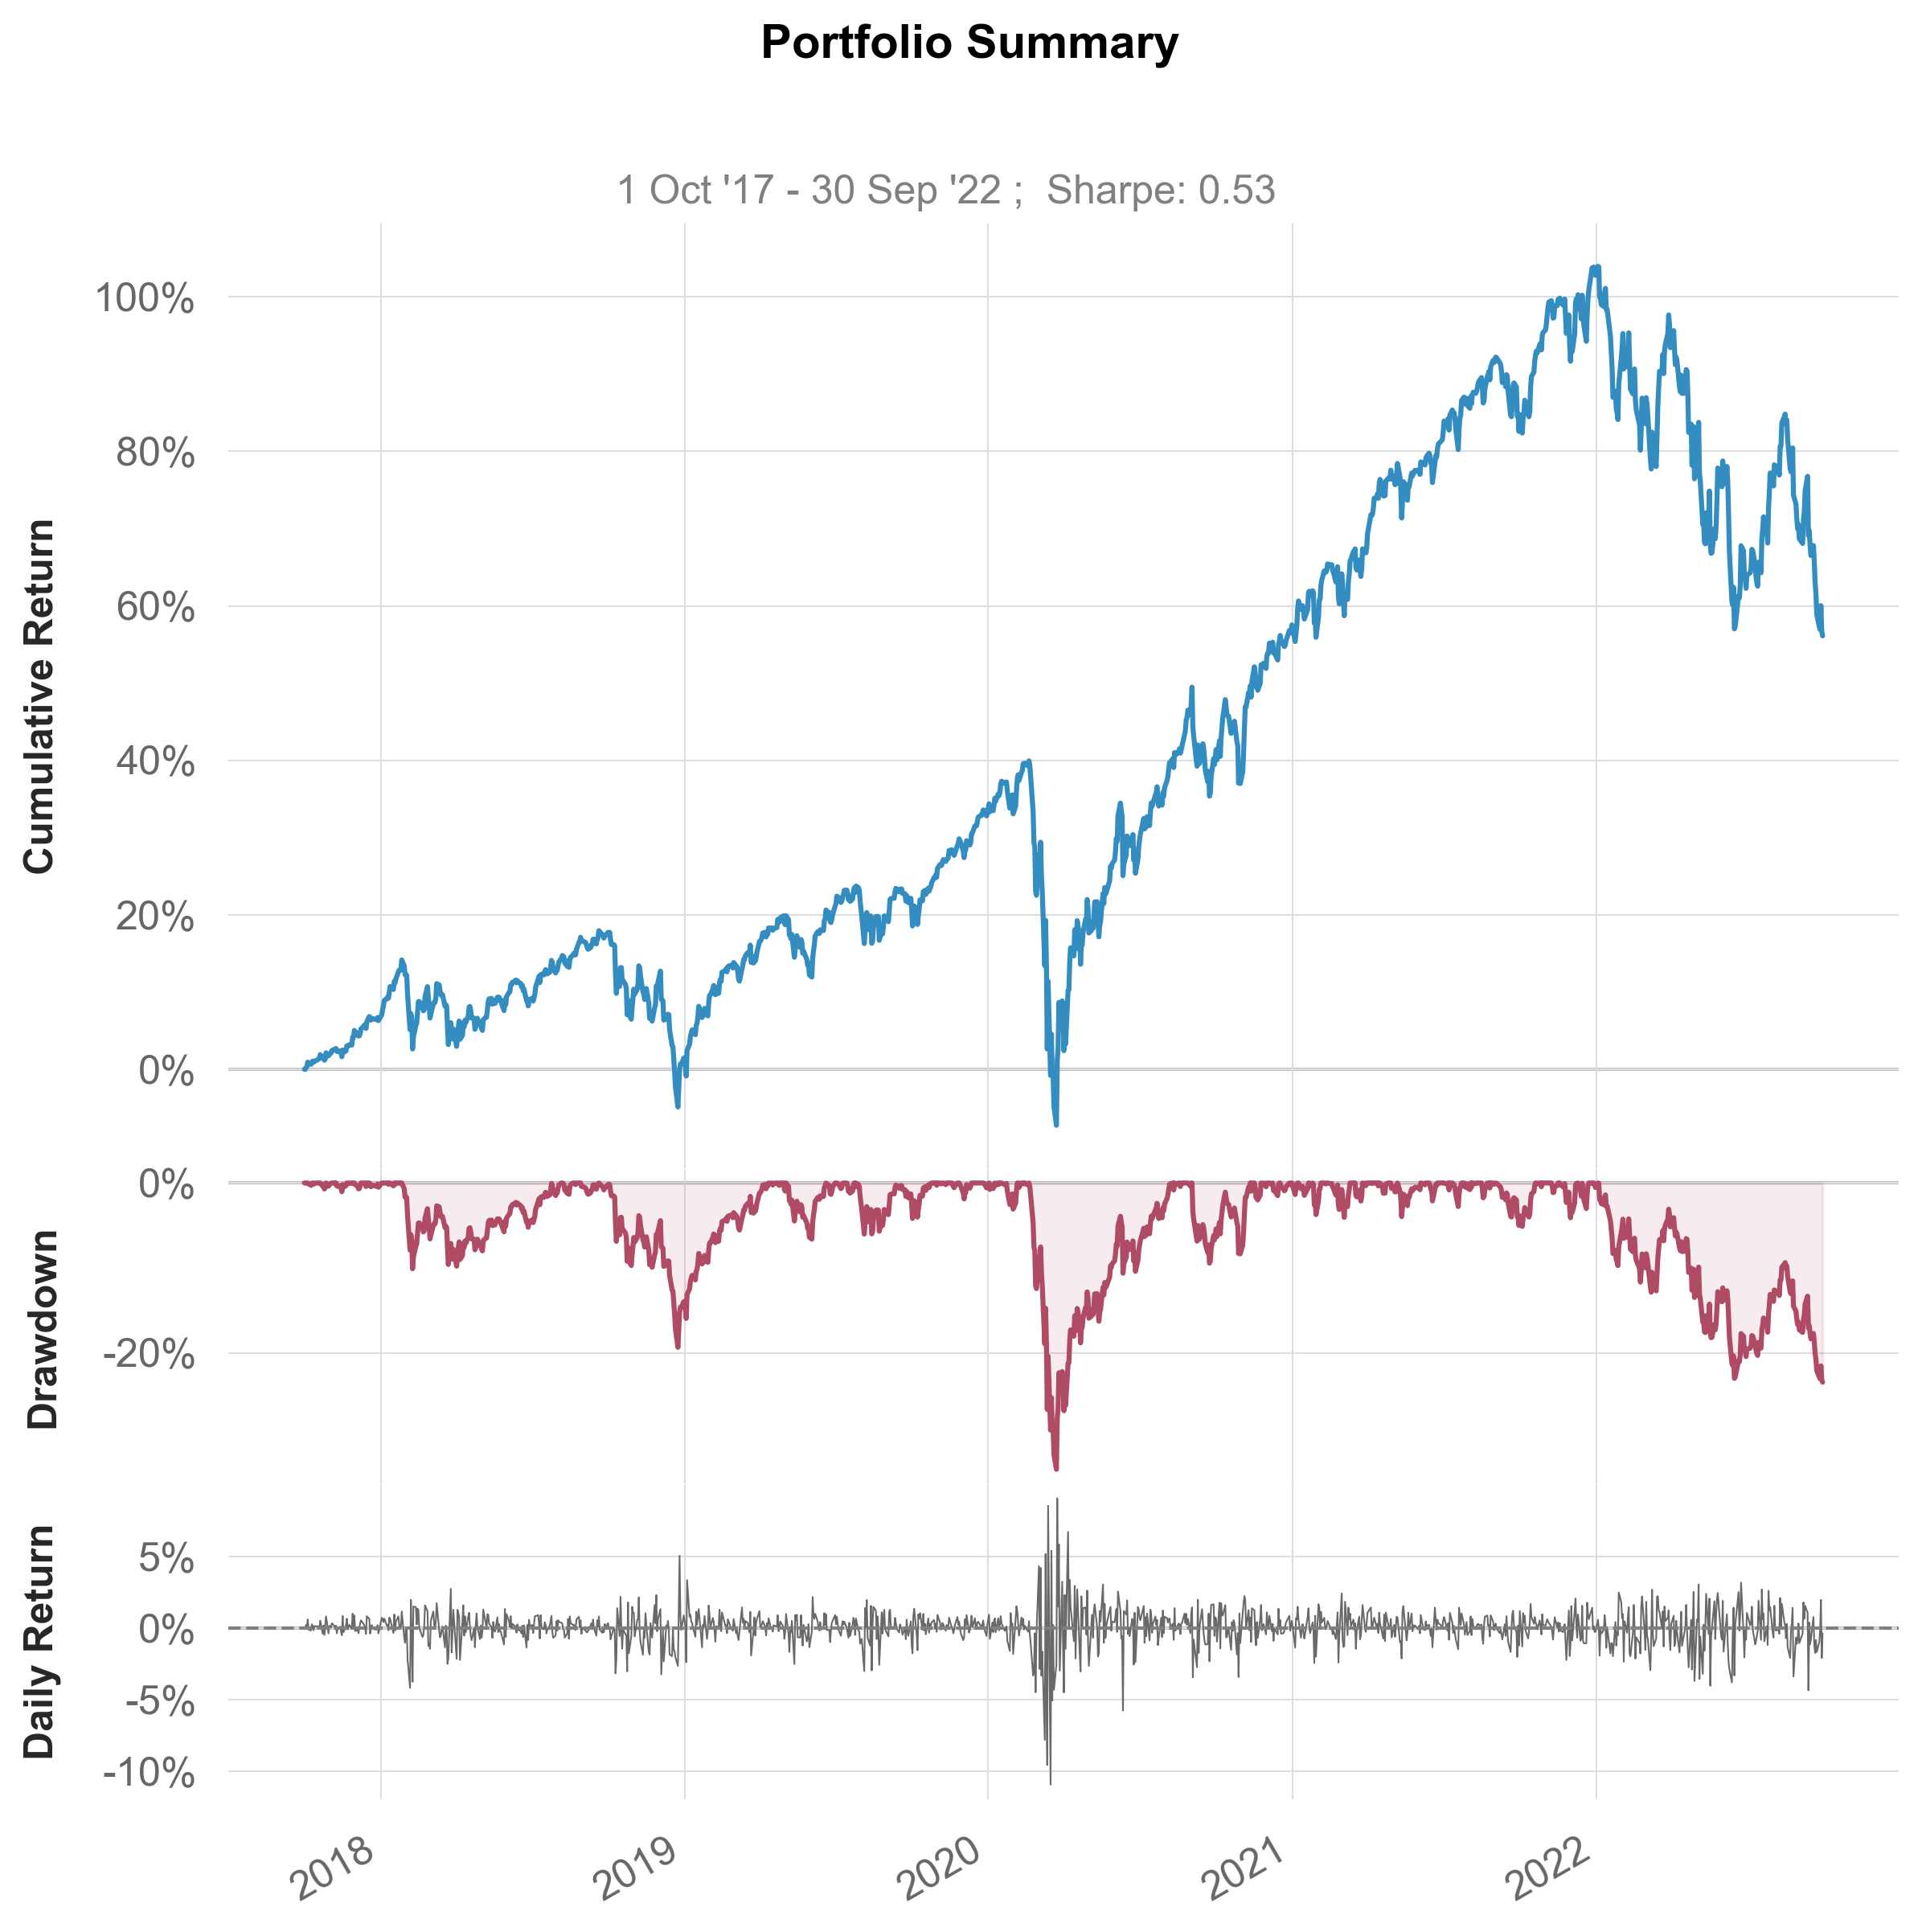
Cumulative Return 56.11% 92.81%
CAGR 9.32% 14.04%
Sharpe 0.53 0.65
Prob. Sharpe Ratio 88.01% 92.36%
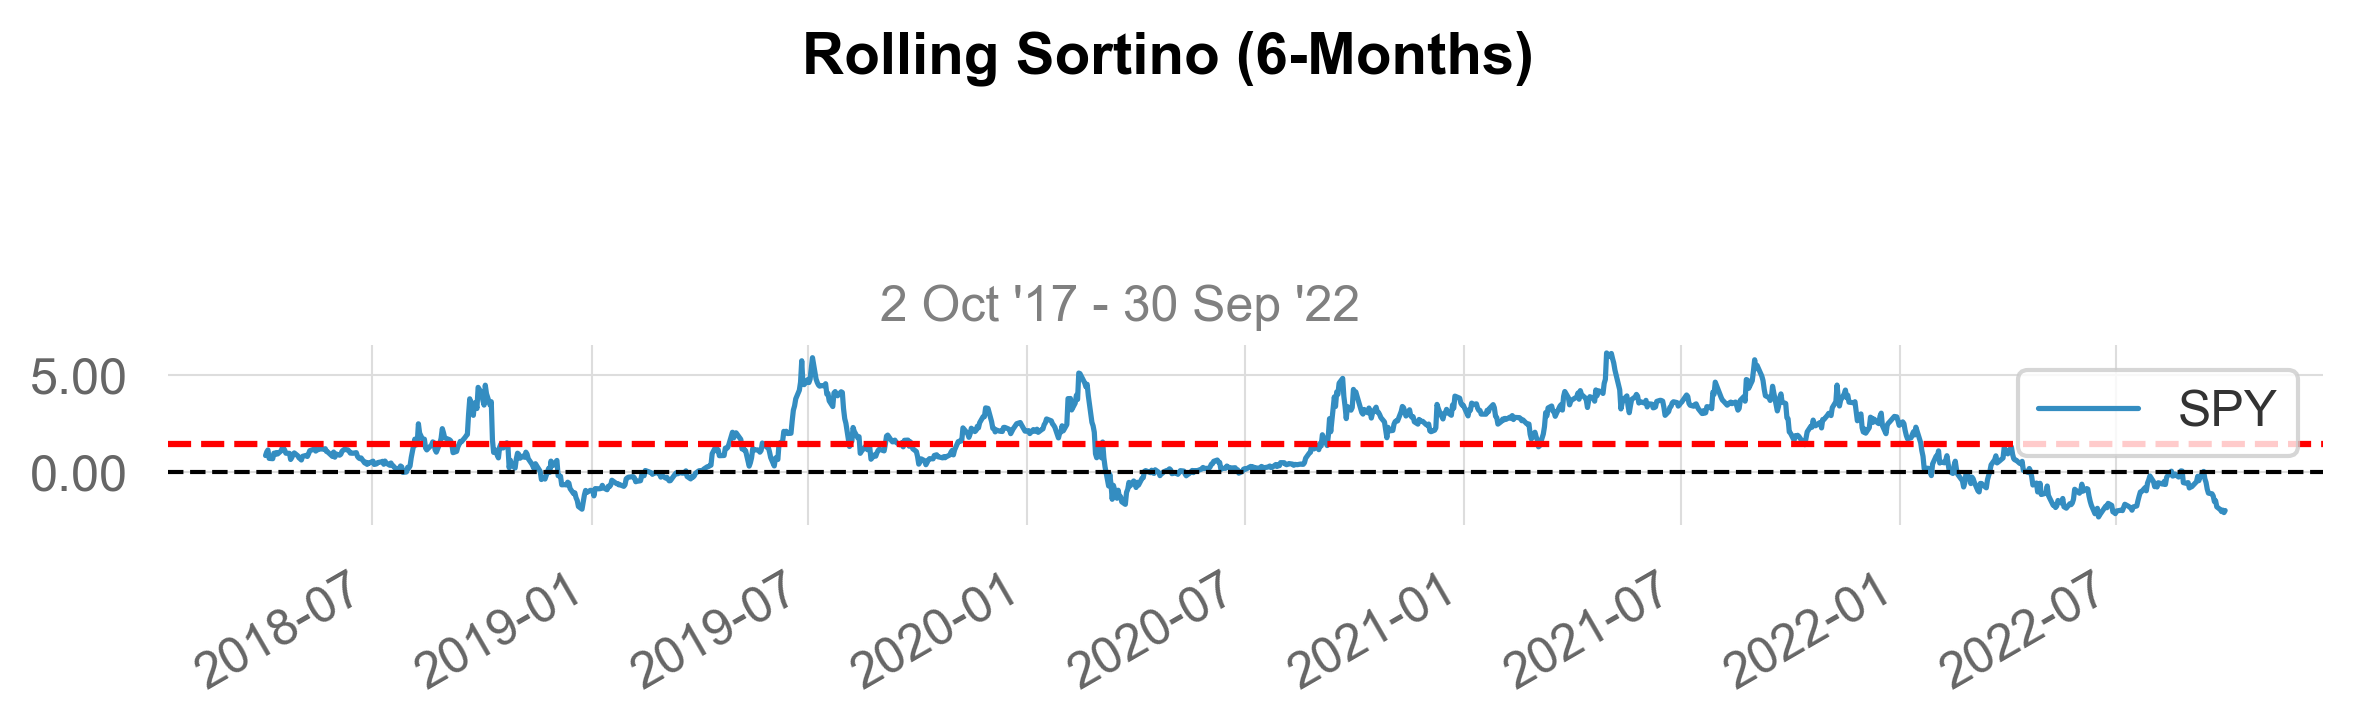
Sortino 0.73 0.89
Sortino/$\sqrt{2}$ 0.51 0.63
Omega 1.11 1.11
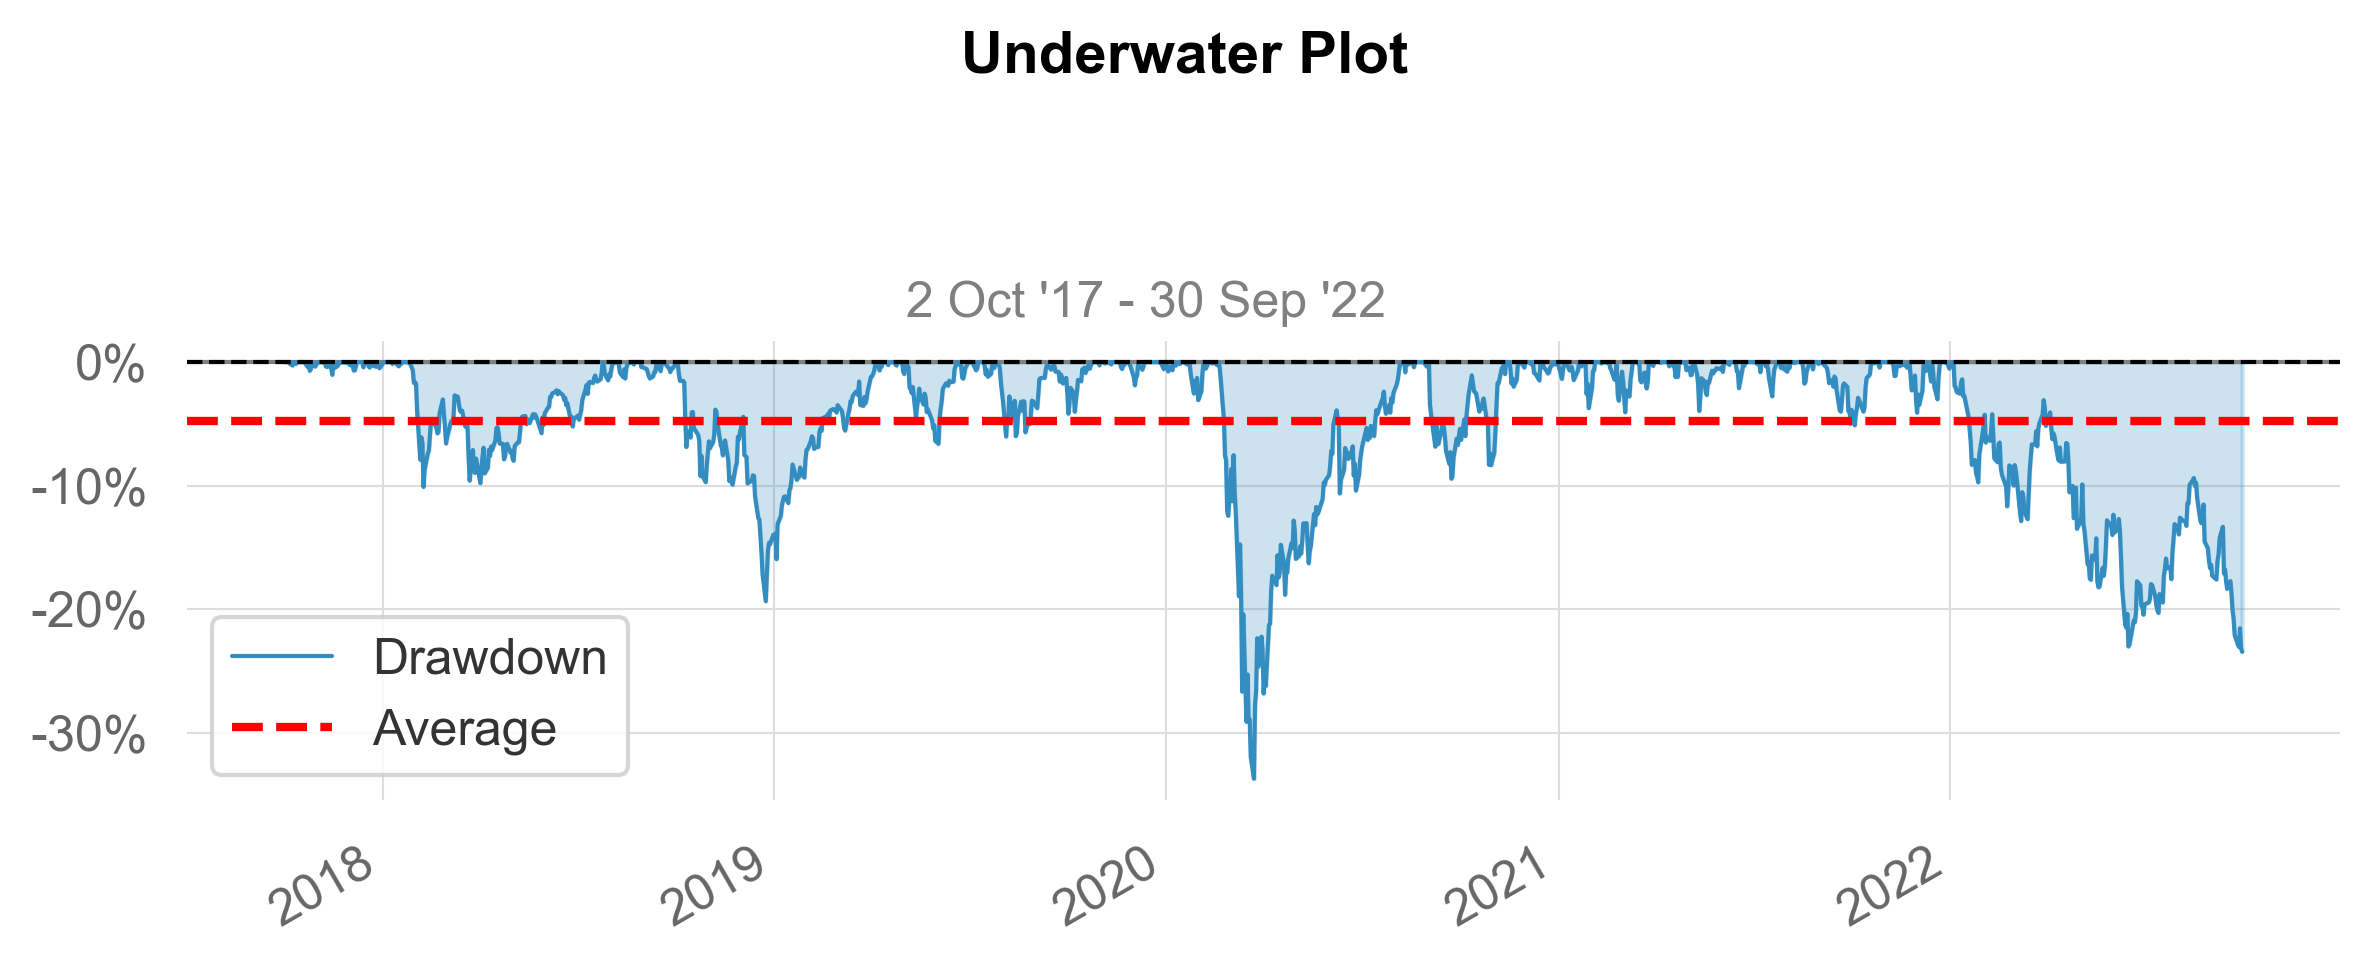
Max Drawdown -33.72% -32.65%
Longest DD Days 269 276
Gain/Pain Ratio 0.11 0.13
Gain/Pain (1M) 0.57 0.75
Payoff Ratio 0.85 0.85
Profit Factor 1.11 1.13
Common Sense Ratio 0.92 0.97
CPC Index 0.52 0.54
Tail Ratio 0.83 0.86
Outlier Win Ratio 4.46 3.47
Outlier Loss Ratio 4.57 3.45
MTD -8.16% -9.19%
3M -4.57% -4.24%
6M -21.02% -26.65%
YTD -23.02% -31.48%
1Y -15.54% -24.02%
3Y (ann.) 7.97% 12.44%
5Y (ann.) 9.0% 13.39%
10Y (ann.) 9.32% 14.04%
All-time (ann.) 9.32% 14.04%
Avg. Drawdown -1.92% -3.07%
Avg. Drawdown Days 16 19
Recovery Factor 1.66 2.84
Ulcer Index 0.08 0.1
Serenity Index 0.66 0.78
source
plots
 plots (returns, benchmark=None, grayscale=False, figsize=(8, 5),
        mode='basic', compounded=True, periods_per_year=252,
        prepare_returns=True, match_dates=False, **kwargs)
returns = _utils.download_returns('SPY', '5y')
benchmark = _utils.download_returns('QQQ', '5y')
plots(returns, benchmark, returns_title = 'SPY', benchmark_title = 'QQQ', mode = 'full')
source
html
 html (returns, benchmark=None, rf=0.0, grayscale=False, title='Strategy
       Tearsheet', output=None, compounded=True, periods_per_year=252,
       download_filename='quantstats-tearsheet.html', figfmt='svg',
       template_path=None, match_dates=False, **kwargs)
Production of .html tearsheets
source
full
 full (returns, benchmark=None, rf=0.0, grayscale=False, figsize=(8, 5),
       display=True, compounded=True, periods_per_year=252,
       match_dates=False, **kwargs)
returns = _utils.download_returns('SPY', '5y')
benchmark = _utils.download_returns('QQQ', '5y')
full(returns, benchmark, display=True, returns_title='SPY', benchmark_title='QQQ')
Performance Metrics
SPY QQQ
------------------------- ---------- ----------
Start Period 2017-10-02 2017-10-02
End Period 2022-09-30 2022-09-30
Risk-Free Rate 0.0% 0.0%
Time in Market 100.0% 100.0%
Cumulative Return 56.13% 92.85%
CAGR 9.32% 14.04%
Sharpe 0.53 0.65
Prob. Sharpe Ratio 88.02% 92.36%
Smart Sharpe 0.45 0.54
Sortino 0.73 0.89
Smart Sortino 0.61 0.75
Sortino/$\sqrt{2}$ 0.51 0.63
Smart Sortino/$\sqrt{2}$ 0.43 0.53
Omega 1.11 1.11
Max Drawdown -33.72% -32.65%
Longest DD Days 269 276
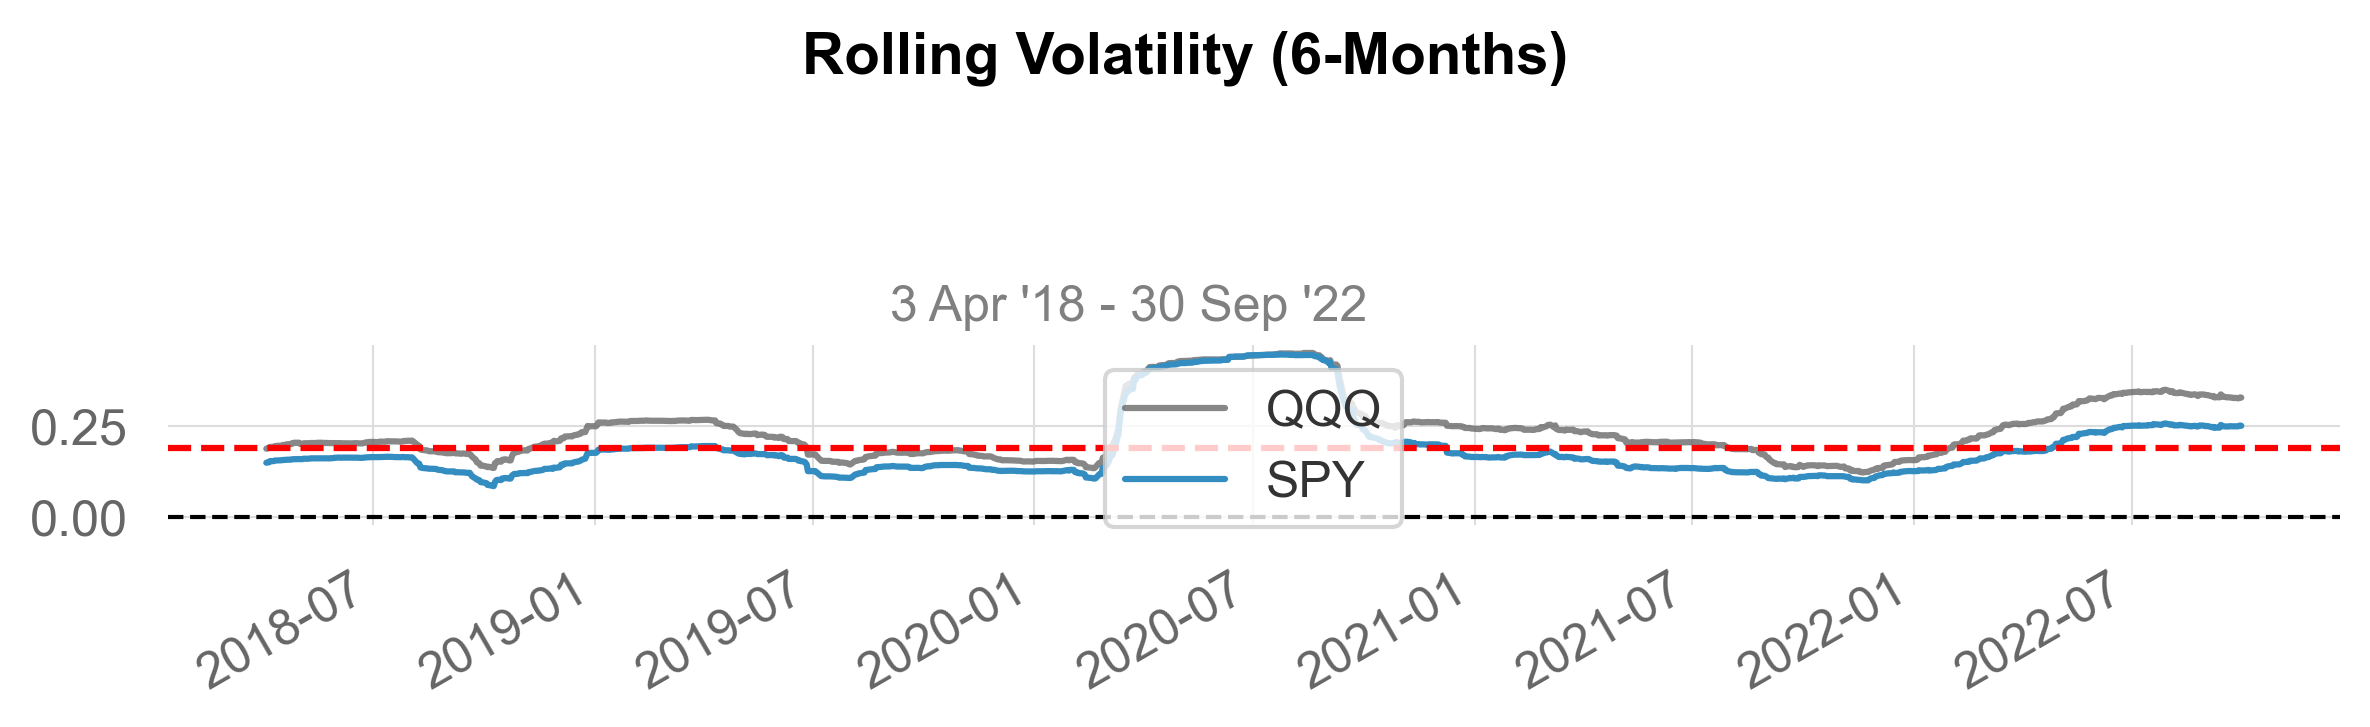
Volatility (ann.) 20.84% 25.29%
R^2 0.87 0.87
Information Ratio -0.03 -0.03
Calmar 0.28 0.43
Skew -0.66 -0.48
Kurtosis 12.01 5.9
Expected Daily % 0.04% 0.05%
Expected Monthly % 0.04% 0.05%
Expected Yearly % 0.04% 0.05%
Kelly Criterion 3.1% 5.27%
Risk of Ruin 0.0% 0.0%
Daily Value-at-Risk -2.11% -2.56%
Expected Shortfall (cVaR) -2.11% -2.56%
Max Consecutive Wins 11 11
Max Consecutive Losses 8 6
Gain/Pain Ratio 0.11 0.13
Gain/Pain (1M) 0.57 0.75
Payoff Ratio 0.85 0.85
Profit Factor 1.11 1.13
Common Sense Ratio 0.92 0.97
CPC Index 0.52 0.54
Tail Ratio 0.83 0.86
Outlier Win Ratio 4.46 3.47
Outlier Loss Ratio 4.57 3.45
MTD -8.15% -9.18%
3M -4.56% -4.23%
6M -21.01% -26.63%
YTD -23.01% -31.46%
1Y -15.53% -24.01%
3Y (ann.) 7.97% 12.45%
5Y (ann.) 9.01% 13.4%
10Y (ann.) 9.32% 14.04%
All-time (ann.) 9.32% 14.04%
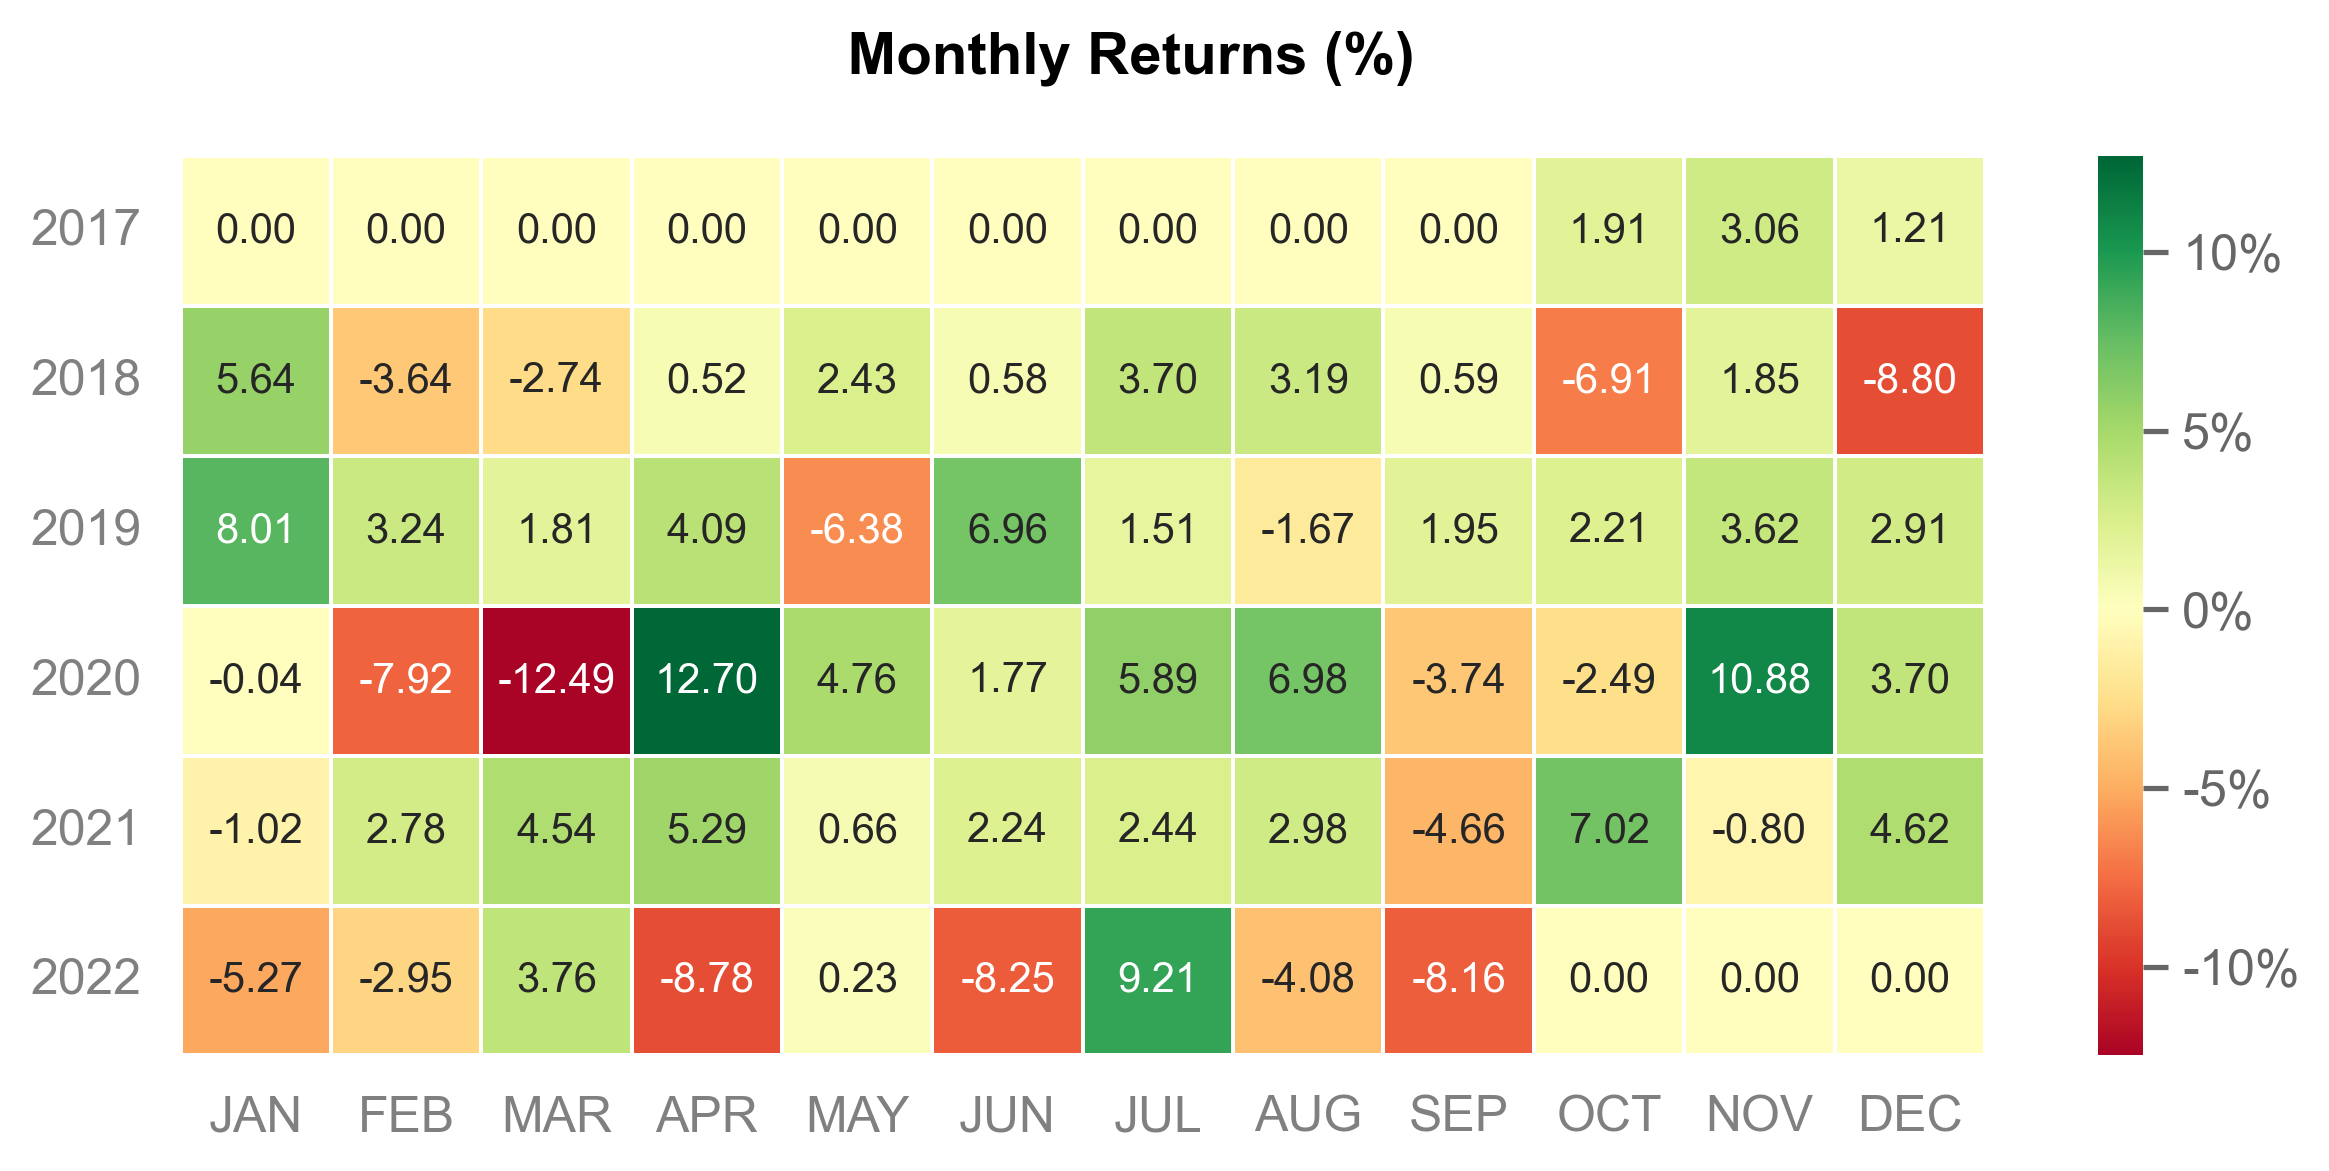
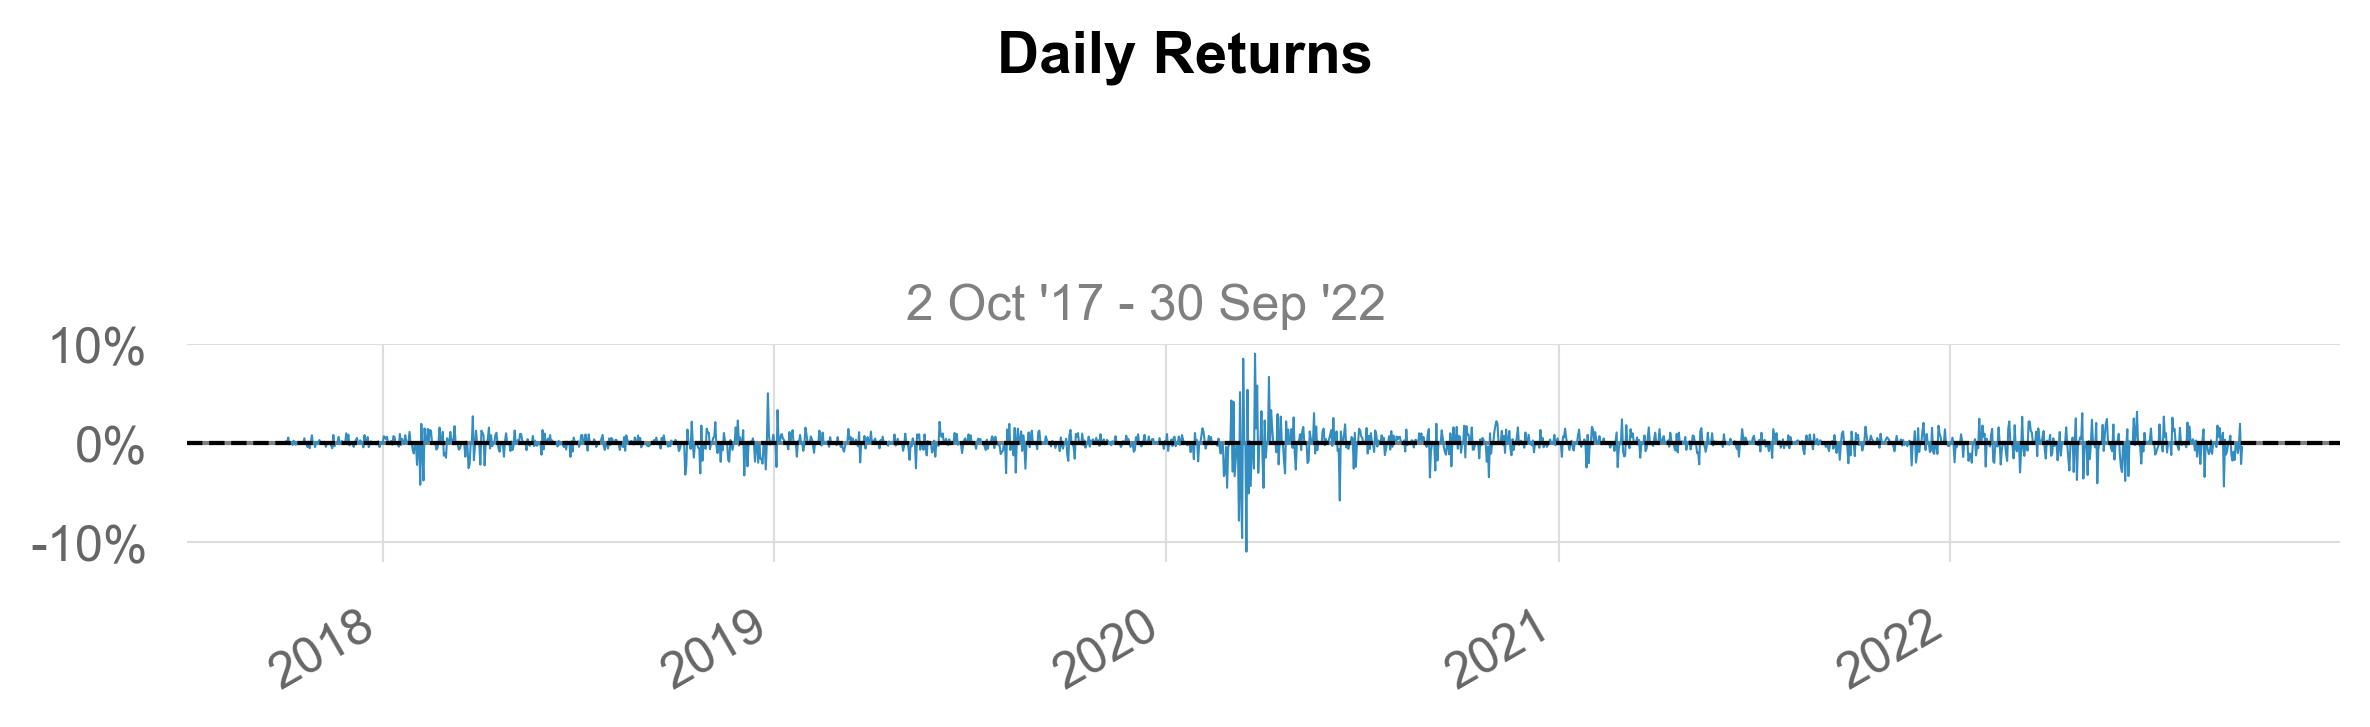
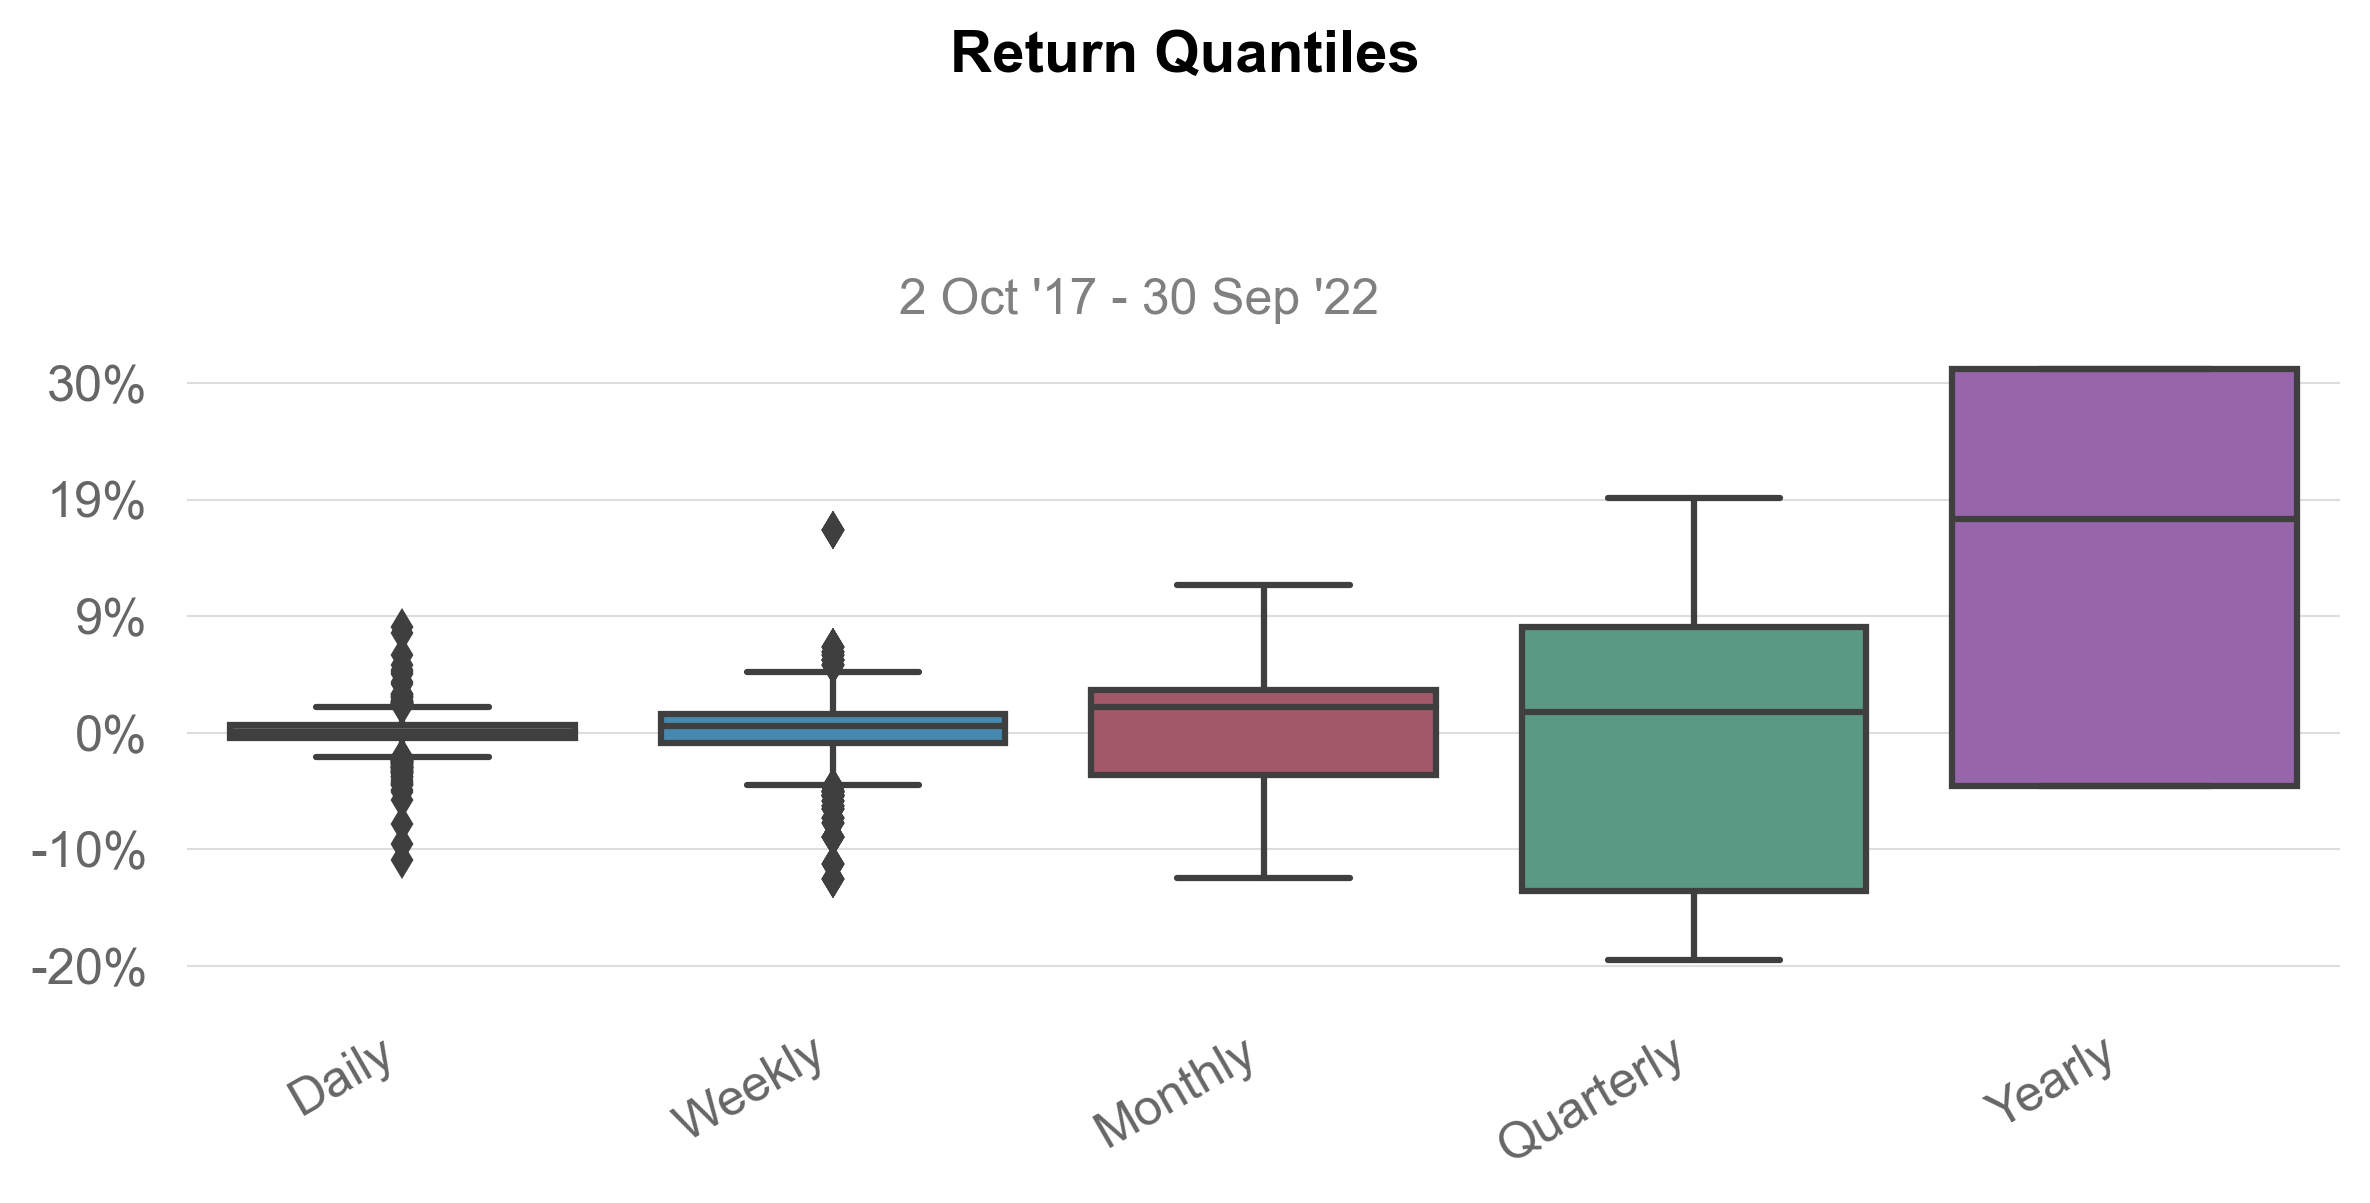
Best Day 9.06% 8.47%
Worst Day -10.94% -11.98%
Best Month 12.7% 14.97%
Worst Month -12.49% -13.6%
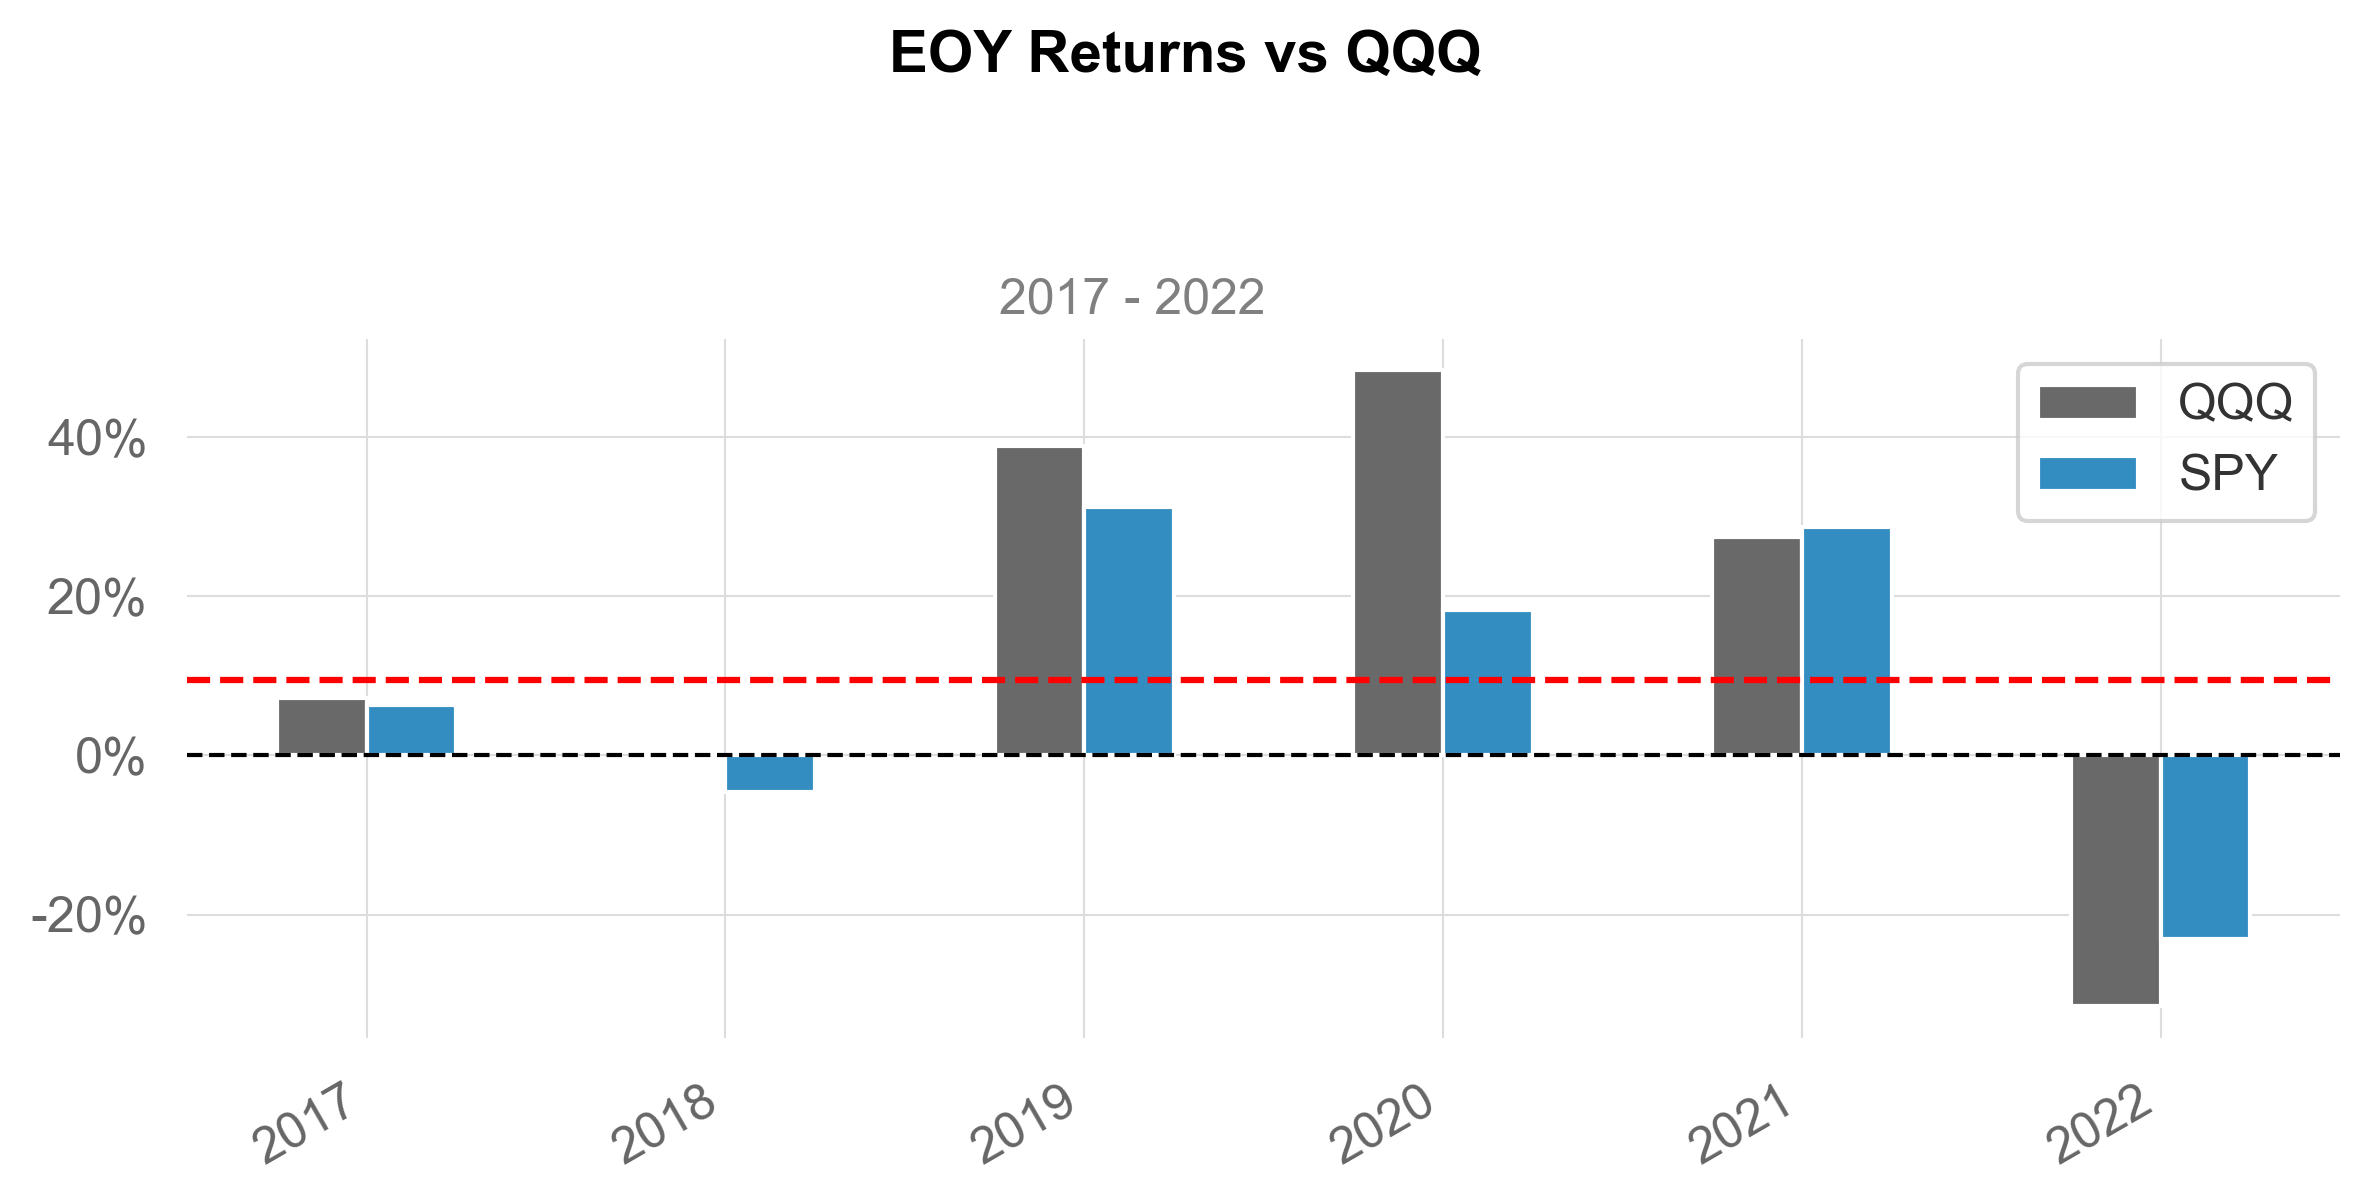
Best Year 31.22% 48.41%
Worst Year -23.01% -31.46%
Avg. Drawdown -1.92% -3.07%
Avg. Drawdown Days 16 19
Recovery Factor 1.66 2.84
Ulcer Index 0.08 0.1
Serenity Index 0.66 0.78
Avg. Up Month 4.21% 5.31%
Avg. Down Month -5.82% -6.51%
Win Days % 55.38% 56.48%
Win Month % 66.67% 63.33%
Win Quarter % 70.0% 75.0%
Win Year % 66.67% 66.67%
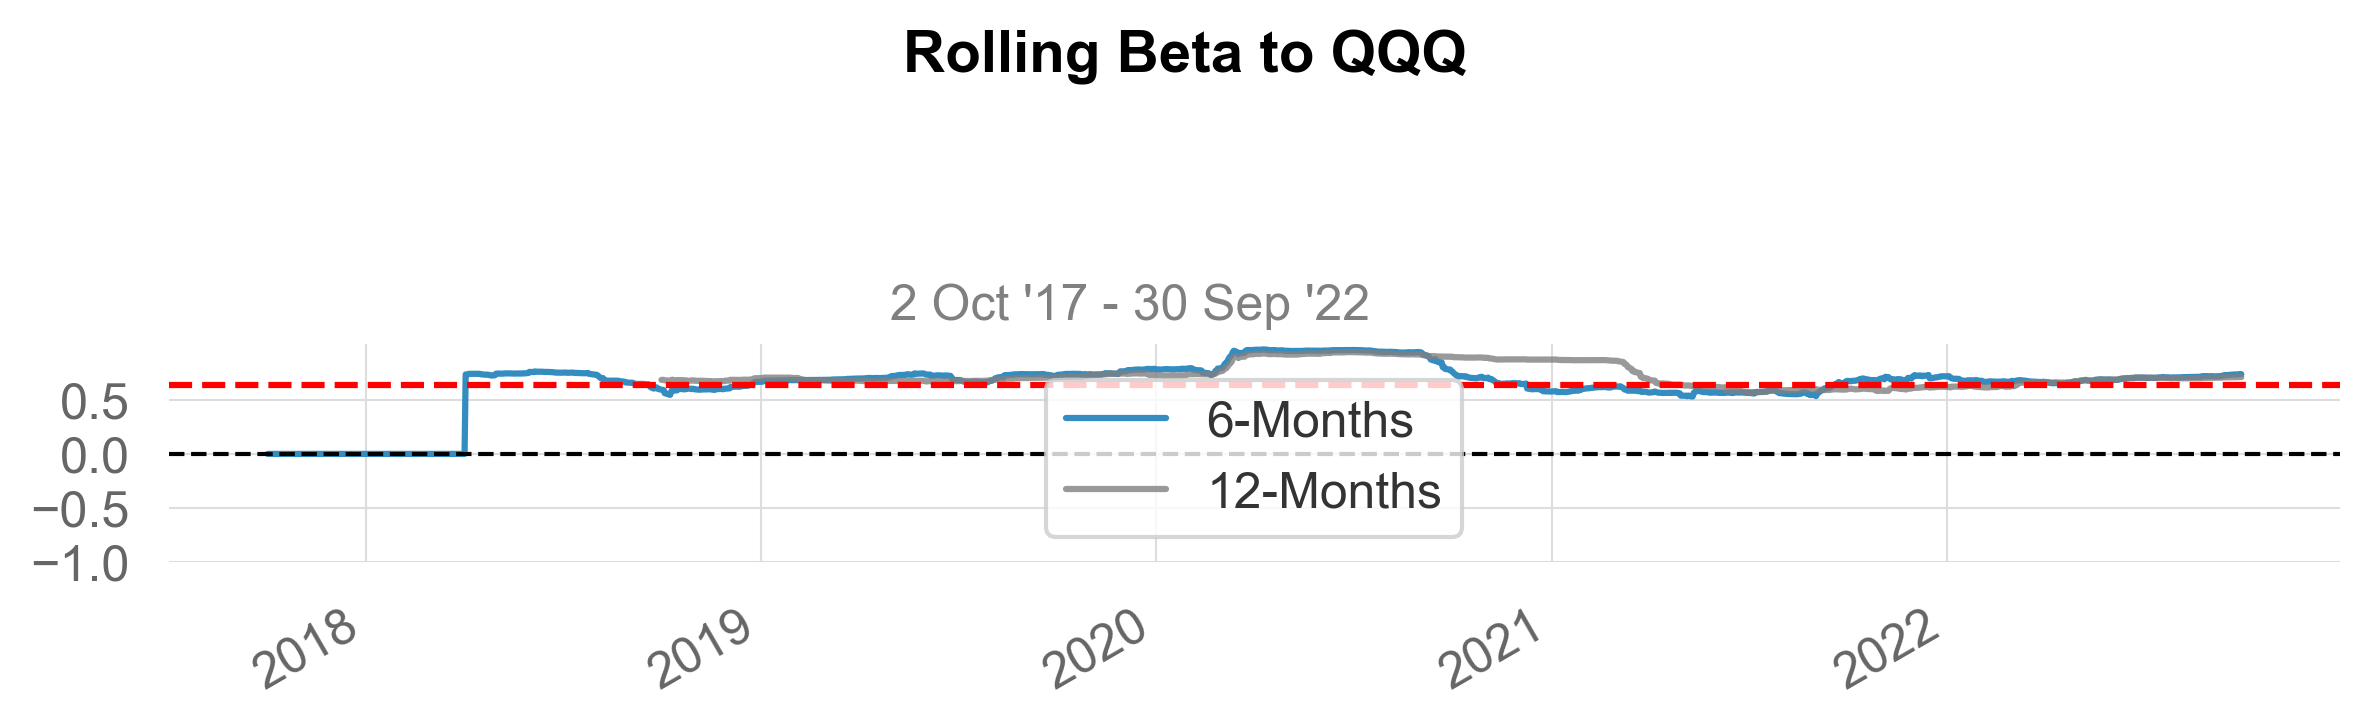
Beta 0.77 -
Alpha -0.01 -
Correlation 93.05% -
Treynor Ratio 73.22% -
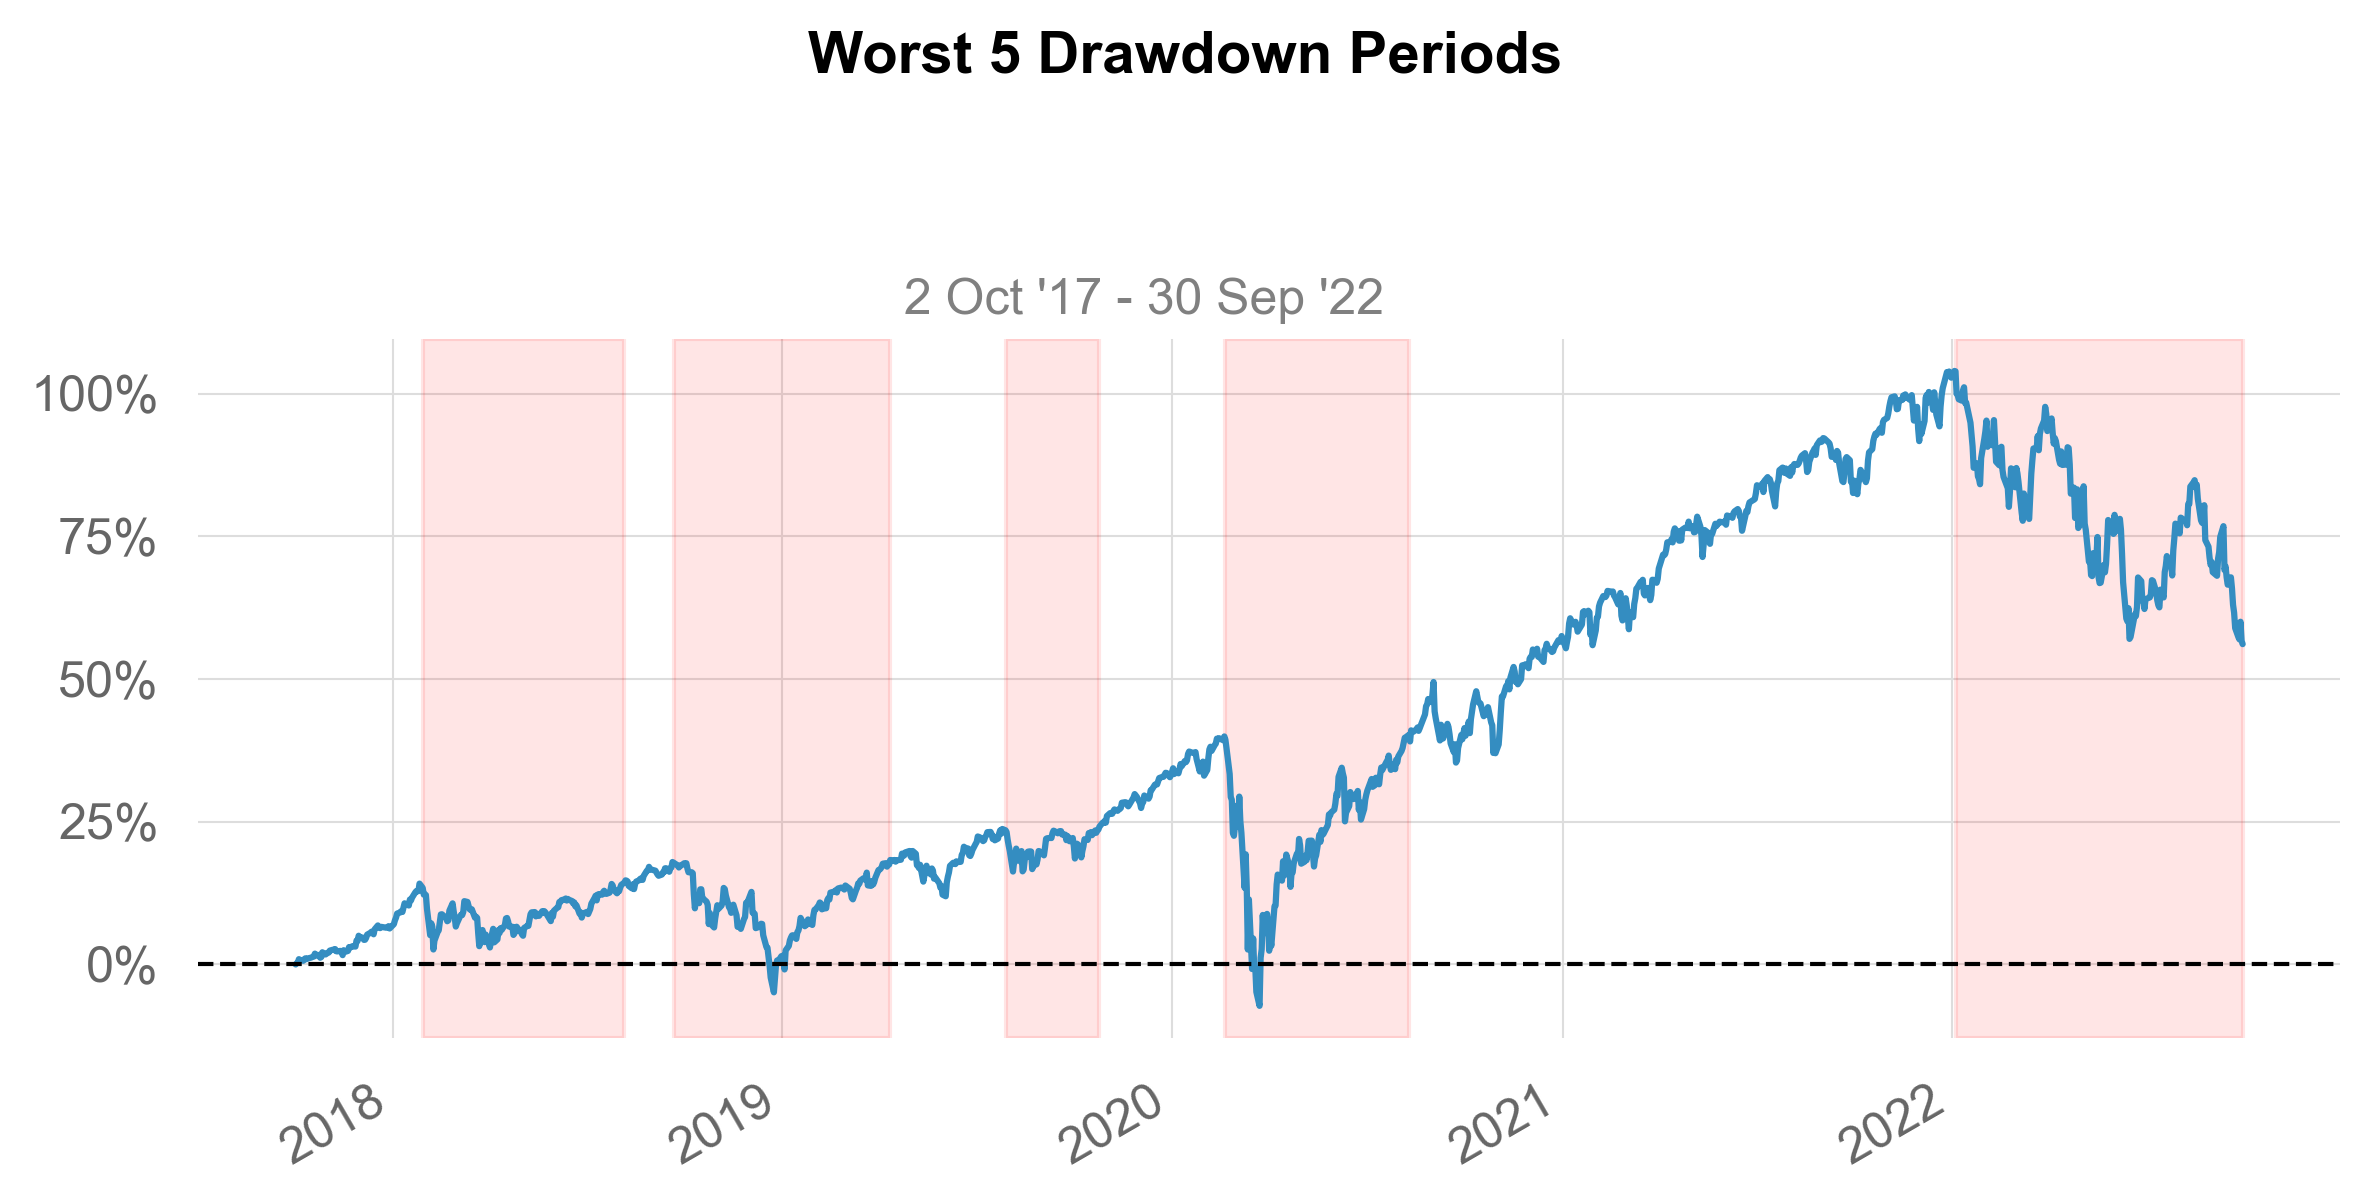
5 Worst Drawdowns
|
Start |
Valley |
End |
Days |
Max Drawdown |
99% Max Drawdown |
| 1 |
2020-02-20 |
2020-03-23 |
2020-08-10 |
172 |
-33.717262 |
-29.109770 |
| 2 |
2022-01-04 |
2022-09-30 |
2022-09-30 |
269 |
-23.448751 |
-23.052213 |
| 3 |
2018-09-21 |
2018-12-24 |
2019-04-12 |
203 |
-19.348908 |
-15.952035 |
| 4 |
2018-01-29 |
2018-02-08 |
2018-08-06 |
189 |
-10.101877 |
-9.594681 |
| 5 |
2020-09-03 |
2020-09-23 |
2020-11-11 |
69 |
-9.440438 |
-9.199067 |
Strategy Visualization
source
basic
 basic (returns, benchmark=None, rf=0.0, grayscale=False, figsize=(8, 5),
        display=True, compounded=True, periods_per_year=252,
        match_dates=False, **kwargs)
returns = _utils.download_returns('SPY', '5y')
benchmark = _utils.download_returns('QQQ', '5y')
basic(returns, benchmark, display=True)
Performance Metrics
                    Close       Close
------------------  ----------  ----------
Start Period        2017-10-02  2017-10-02
End Period          2022-09-30  2022-09-30
Risk-Free Rate      0.0%        0.0%
Time in Market      100.0%      100.0%

Cumulative Return   56.11%      92.86%
CAGR                9.32%       14.05%

Sharpe              0.53        0.65
Prob. Sharpe Ratio  88.01%      92.37%
Sortino             0.73        0.89
Sortino/$\sqrt{2}$  0.51        0.63
Omega               1.11        1.11

Max Drawdown        -33.72%     -32.65%
Longest DD Days     269         276

Gain/Pain Ratio     0.11        0.13
Gain/Pain (1M)      0.57        0.76

Payoff Ratio        0.85        0.85
Profit Factor       1.11        1.13
Common Sense Ratio  0.92        0.97
CPC Index           0.52        0.54
Tail Ratio          0.83        0.86
Outlier Win Ratio   4.46        3.47
Outlier Loss Ratio  4.57        3.45

MTD                 -8.16%      -9.17%
3M                  -4.57%      -4.22%
6M                  -21.02%     -26.63%
YTD                 -23.02%     -31.46%
1Y                  -15.54%     -24.0%
3Y (ann.)           7.97%       12.45%
5Y (ann.)           9.0%        13.4%
10Y (ann.)          9.32%       14.05%
All-time (ann.)     9.32%       14.05%

Avg. Drawdown       -1.92%      -3.07%
Avg. Drawdown Days  16          19
Recovery Factor     1.66        2.84
Ulcer Index         0.08        0.1
Serenity Index      0.66        0.78
Strategy Visualization